Hello. I have been stuck with this issue for a few days and now approaching a deadlock.
Basically, I want to achieve the following:
https://www.youtube.com/watch?v=s8M6B6uGbfQ
We at BAT are working on Nordic products for a quite a while and did not have SWO pin exposed. We do have it now on some custom dev boards. Of course we use RTT viewer as well but that is for print logs. Since our main IDE is IAR, we would like to achieve its full functionality.
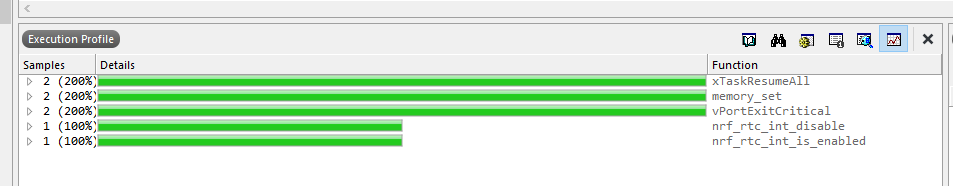
To achieve code profiling, ITM (Instruction trace macrocell), and SWO trace, the SWO pin is enough. I have managed to send some data using ITM_SendChar(); and I can see the data on SWO Viewer. I cannot see anything on IAR'ss terminal window or the timeline window where I am expecting to see some graphs.
I have searched online but hardly found any tutorials for Jlink, but only I-jet. To get down to basics, I am now using the nRF52840 Dev board, and using its on board programmer. For sure SWO works, otherwise I could not see the data on SWO Viewer.
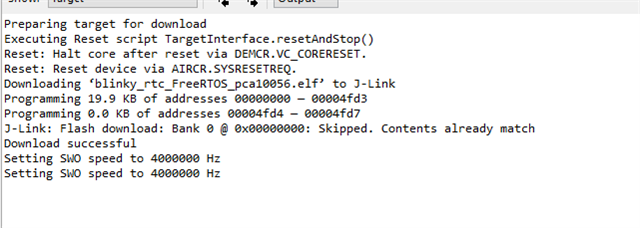
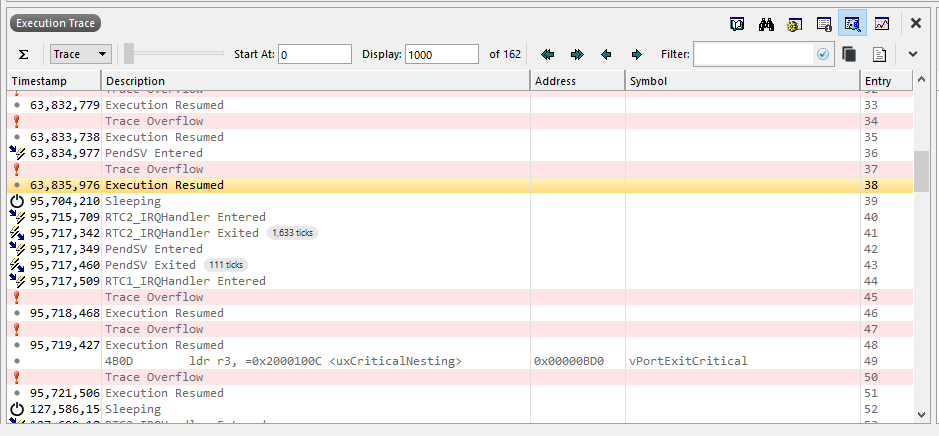
i am using the simple blinky freeRTOS out of the box example. As you can see in screenshot, I do not see anything in SWO Trace Timeline: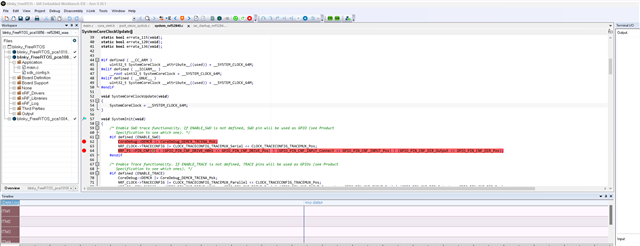
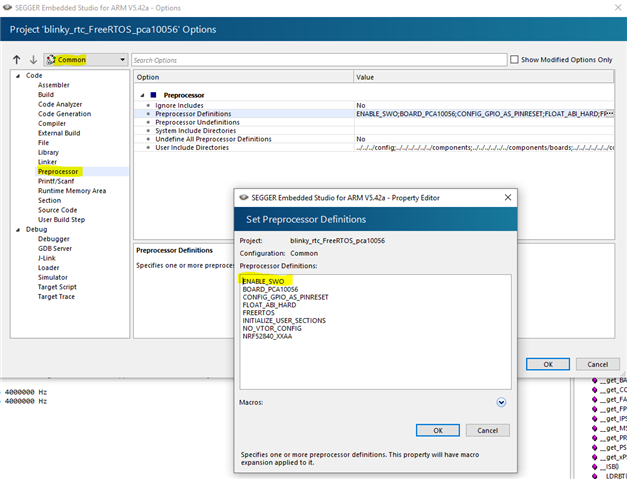
For the SWo configuration, I am using the following values: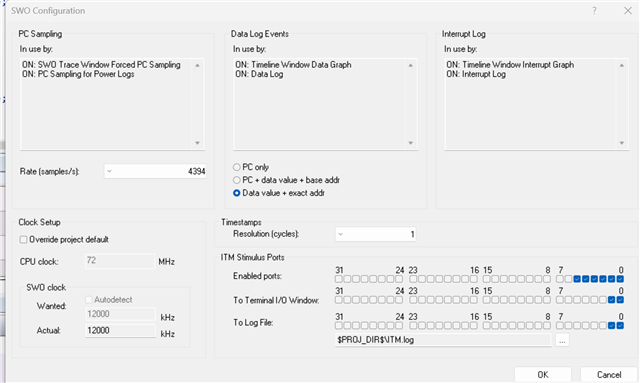
In the bottom left, I have tried a number of combinations, even what the SWO viewer tells me by default which is 64 MHz core clock and 6000 KHz SWo frequency: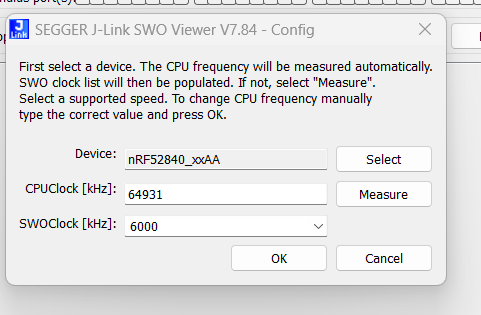
I feel like I have exhausted my options would benefit from an expert from your side to help me out on this matter. We have some urgent issues to debug and we want to get past the traditional debugger pause and play as we have a dev board we can use SWO on.
Kind Regards
Ali