Not possible to restart debugging without reloading in VSCode (nrf9160dk)

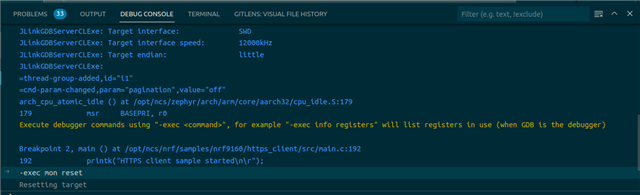
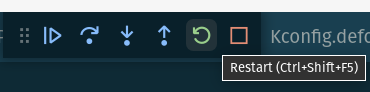
I'm trying desperately to find a way to restart a debugging session (reset device and go back to main) on the nrf9160dk without reloading the FW onto the device.

I'm using VSCode and the nordic 2.3.0 sdk & toolchain.  

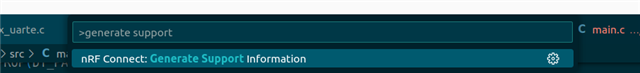
I'm desperate to find way(s) to improve the debugging features, which aren't at the same level as those found in more customary embedded IDEs, and it's affecting our ability to use the tools at all.  If there is anything I can do, I will consider it.  If I can fix problems by using an external JLink (for example) or using non-nordic extension, I will try anything.

  • Hi,


    I share your concerns.

    This is an improvement task that I've raised internally.


    As a workaround, you can issue gdb commands in the debug console by first appending "-exec", for instance monitor reset:

    Could you try this and see if that works for you?


    Kind regards,

    Håkon

  • This workaround helps, although I do seriously hope your improvements also get implemented.  I will describe my experience with the workaround.

    This workflow does NOT work.  It results in an error (copied below).

    1. Set a breakpoint, and wait for it to hit.
    2. apply -exec mon reset
    3. Push resume button

    Thread 15 hit Breakpoint 2 ...
    -exec mon reset
    Resetting target
    [New Remote target]
    /Volumes/Workspace/build/.build/HOST-aarch64-apple-darwin/arm-zephyr-eabi/src/gdb/gdb/infrun.c:5825: internal-error: finish_step_over: Assertion `ecs->event_thread->control.trap_expected' failed.
    A problem internal to GDB has been detected,
    further debugging may prove unreliable.
    Quit this debugging session? (y or n) [answered Y; input not from terminal]
    /Volumes/Workspace/build/.build/HOST-aarch64-apple-darwin/arm-zephyr-eabi/src/gdb/gdb/infrun.c:5825: internal-error: finish_step_over: Assertion `ecs->event_thread->control.trap_expected' failed.
    A problem internal to GDB has been detected,
    further debugging may prove unreliable.
    Create a core file of GDB? (y or n) [answered Y; input not from terminal]
    ERROR: GDB exited unexpectedly with exit code 134 (0x86). Debugging will now abort.
    The program '/Users/jpnorair/.../build/zephyr/zephyr.elf' has exited with code -1 (0xffffffff).

    This other workflow does provide a workaround, however:

    1. Set a user breakpoint at main()
    2. Set another breakpoint where you want it, wait for it to hit.
    3. Step the debugger
    4. apply -exec mon reset
    5. Push resume button
    6. Debugger WILL arrive at the breakpoint on main()

    With this workaround, I am at least able to debug the software we need to work-on.  Thank you: your suggestion was very helpful.

    I will add an additional point -- I wrote another ticket recently about issues programming the target (https://devzone.nordicsemi.com/f/nordic-q-a/100497/vs-code-debug-flash-works-once-then-fails-on-second-instantiation).  By applying [-exec mon reset] when I am finished with the debugging session, I am able to flash the board again without problems (at least, so far).

  • Hi,


    My apologies for coming with bad advice here, and I'm glad to hear that you have found a partial workaround to the problem.

    I have confirmed with testing and R&D that we have seen similar behavior with GDB when issuing a monitor reset command. I'll ask the team to look deeper into this, and possibly bring it up with segger as well.

    jpnorair said:

    This other workflow does provide a workaround, however:

    1. Set a user breakpoint at main()
    2. Set another breakpoint where you want it, wait for it to hit.
    3. Step the debugger
    4. apply -exec mon reset
    5. Push resume button
    6. Debugger WILL arrive at the breakpoint on main()

    A question that came up when discussing this with the VS Code team:

    How does the green restart button behave at your end?

    The intended behavior is that it should quickly (ie. in less than 5 seconds) reload the debug session and reset your device, ie. no loading of the firmware, unless there has been a change in the firmware itself.

    Is this the reset source that you've been using?


    Kind regards,

    Håkon

  • This reset button is the first thing I tried.

    It indeed performs a reloading of the fw onto the target, which is not only slow but also full of problems (you can see the other ticket for this).  The only way I've found to successfully restart the device (or reset it at all) is via the [-exec mon reset] command you presented.

    Having a fast reset is very important if trying to breakpoint-debug in the presence of a second core which doesn't stop when the first core is breakpointed.  Most nordic products seem to have a second core for the comms stack.

  • Thank you for elaborating on your process.

    The intended process is that the device shall reset (ie. exit and re-enter debug mode) without having to flash again.

    I have seen this behavior before, but I am not able to successfully recreate this at my end now, unfortunately. I've tested with a macbook m1 (big sur) and two different linux PCs (Intel and AMD based).


    Q1: Are there specific projects that invoke this behavior at your end, or is it pretty much any sample in the NCS tree?

    Q2: Could you share the report generated by executing this command in vscode?


    Kind regards,

    Håkon

Related