SPIS on NRF52840

I've been struggling bringing up a working SPIS test application and would appreciate any help I can get.  I'm much more of a HW person, so this hyper abstracted Zephyr stuff is not easy for me.

First Question:

In my overlay (see below) for the reg: attribute, I get the warning:  

Node spi-dev-a should have "compatible" property
Node should only occur on the undefined bus.

/soc/spi@40004000/spi-dev-a@0/

I've seen in https://devzone.nordicsemi.com/f/nordic-q-a/93484/struggling-to-use-spi-with-zephyr  

the following response:  "The overlay warnings I can see here also, but they don't seem to affect the example. I will try to find some time later to look into this."  referring to a similar warning, so I'm not sure if this actually an issue or not.

my_spis: &spi1 {
    compatible = "nordic,nrf-spis";
    status = "okay";
    pinctrl-0 = <&spi1_default>;
    pinctrl-1 = <&spi1_sleep>;
    pinctrl-names = "default", "sleep";
    cs-gpios = <&gpio0 29 GPIO_ACTIVE_LOW>;
    def-char = <0x00>;

    reg_my_spis: spi-dev-a@0 {
        reg = <0>;
    };

};


&spi1_default {
    group1 {
        psels = <NRF_PSEL(SPIS_SCK, 0, 31)>,
                <NRF_PSEL(SPIS_MOSI, 0, 30)>,
                <NRF_PSEL(SPIS_MISO, 1, 8)>;

    };
};

Are there any issues that are easily seen with this?

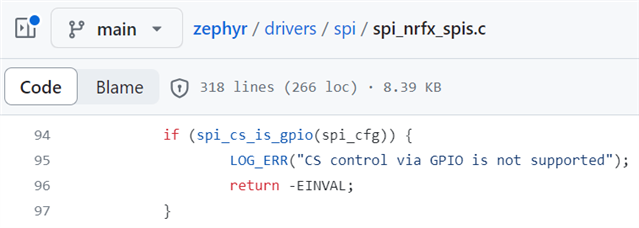
if (!device_is_ready(spi_cs.gpio.port)) and  if (!device_is_ready(spi_dev))  both report back that the SPI instance and the CS are ready.  So, I'm inclined to think that this is a non-issue.  Thoughts?
Second Question:
I am calling:  err = spi_transceive_cb(spi_dev, &spi_cfg, NULL, &rx, spi_slave_callback, NULL); which is constantly returning -22 (EINVAL).
Besides the overlay, here are the other relevant bits:
CONFIG_SPI=y
CONFIG_GPIO=y
CONFIG_SPI_SLAVE=y
CONFIG_SPI_ASYNC=y
CONFIG_DEBUG=y
CONFIG_PRINTK=y
#CONFIG_NRFX_SPIS1=y
CONFIG_USERSPACE=n
CONFIG_UART_CONSOLE=y
CONFIG_LOG=y
#CONFIG_LOG_BACKEND_RTT=n
CONFIG_LOG_BACKEND_UART=y
CONFIG_LOG_PRINTK=y
CONFIG_LOG_DEFAULT_LEVEL=4 


CONFIG_HEAP_MEM_POOL_SIZE=50512
#CONFIG_IDLE_STACK_SIZE=4096
#CONFIG_SYSTEM_WORKQUEUE_STACK_SIZE=4096
CONFIG_MAIN_STACK_SIZE=4096


CONFIG_USE_SEGGER_RTT=n
#CONFIG_RTT_CONSOLE=n
CONFIG_SERIAL=y
struct spi_config spi_cfg = {
	.operation = SPI_WORD_SET(8) | SPI_OP_MODE_SLAVE | SPI_TRANSFER_MSB |
				 SPI_LINES_SINGLE,
	.frequency = 4000000,
	.slave = 0,
};
After the CS line is tested as ready:
	spi_cfg.cs = &spi_cs;
Here is setting the spi_cs_control struct:
static struct spi_cs_control spi_cs = {
	//	.gpio.pin = cs_gpio_pin,
	//	.gpio.dt_flags = cs_gpio_flags,
	.gpio = SPI_CS_GPIOS_DT_SPEC_GET(DT_NODELABEL(reg_my_spis)),
	.delay = 0,
};
Here is setting up the rx buffer:
		const struct spi_buf rx_buf = {
			.buf = buffer,
			.len = BUFFER_SIZE,
		};
		const struct spi_buf_set rx = {
			.buffers = &rx_buf,
			.count = 1,
		};
Here is the prototype for the CB:
void spi_slave_callback(const struct device *dev, int result, void *data)
There is a print statement upon enter the CB, so it's obviously not getting that far.
Does anything look obviously amiss here?  Does anyone have any suggestions on figuring out what is triggering the -EINVAL?  
Thank you for any guidance!
Parents
  • Ok, I have the log information now going.  The -EINVAL is from this error message:   spi_nrfx_spis: CS control via GPIO is not supported

    I am assuming at this point that something in my overlay is not quite right with regards to the CS definition.  This information should be in the previous post.

    Thanks in advance for any thoughts.

    -Keith

  • As I understand this now, the SPI Slave code does not support monitoring a GPIO line assigned as a CS control line.  This is still a bit opaque from the zephyr and other documentation.

    Passing a NULL value into spi_cfg.cs allows the spi_transceive_cb to be called without an immediate error being thrown.

    I'm in the process of manually checking for the state of a cs line and should have some more code ready test later today.  

    Does anyone know if there is a decent write-up on the SPI support software and its functionality for NRF running zephyr? 

Reply
  • As I understand this now, the SPI Slave code does not support monitoring a GPIO line assigned as a CS control line.  This is still a bit opaque from the zephyr and other documentation.

    Passing a NULL value into spi_cfg.cs allows the spi_transceive_cb to be called without an immediate error being thrown.

    I'm in the process of manually checking for the state of a cs line and should have some more code ready test later today.  

    Does anyone know if there is a decent write-up on the SPI support software and its functionality for NRF running zephyr? 

Children
  • Hi Keith,

    Thank you for being patient.

    Device yaml files define the device bindings and that can be used as guidelines for writing overlays.

    If some properties are marked as required, then those must be define in the DT overlays for those devices.

    As you are using nordic spis driver, looking at the driver code suggests the same what you were referring to.

    The spi_nrfx_transceive function, under the hood, calls transceive function which in turn calls device configure (configure(dev,spi_cfg)) function. If, in calling transceive from nrf_spis driver, spi_cfg->cs is defined then it would return error. So definitely, putting NULL in the cs should resolve this issue.

  • Thank you for confirming this.

    I have code that now manually monitors a cs line and triggers a call to spi_transceive_cb.  (see below).  The first SPI transaction calls spi_transceive_cb and it returns a zero.  The second transaction throws up some debug messages from the MPU module (see further below).  In both cases I never see output from my callback function.

    I'll continue to debug on this, but if there is something obvious that I'm not doing correctly, please let me know.

    I have verified with a logic analyzer that the SPI transmission to the NRF are happening correctly.

    struct spi_config spi_cfg = {
    	.operation = SPI_WORD_SET(8) | SPI_OP_MODE_SLAVE | SPI_TRANSFER_MSB |
    				 SPI_LINES_SINGLE,
    	.frequency = 4000000,
    	.slave = 0,
    };
    
    ...................
    
    while (1)
    	{
    		//printf("Loop %d\n", loop_count++);
    		const struct spi_buf rx_buf = {
    			.buf = buffer,
    			.len = BUFFER_SIZE,
    		};
    		const struct spi_buf_set rx = {
    			.buffers = &rx_buf,
    			.count = 1,
    		};
    		/*
    				const struct spi_buf tx_buf = {
    					.buf = buffer,
    					.len = BUFFER_SIZE,
    				};
    				const struct spi_buf_set tx = {
    					.buffers = &tx_buf,
    					.count = 1,
    				};
    		*/
    		// receive data packet
    		//LOG_ERR("About to Call pin_get\n");
    		int cs_state = gpio_pin_get(gpio_dev, cs_pin);
    		//LOG_ERR("Just after calling pin_get\n");
    		if (cs_state < 0)
    		{
    			printf("error in reading cs pin state.\n"); /* handle error */
    		}
    		else if (cs_state == 0)
    		{
    			__asm__ volatile("nop");
    			err = spi_transceive_cb(spi_dev, &spi_cfg, NULL, &rx, spi_slave_callback, NULL);
    			__asm__ volatile("nop");
    			printf("Out of spi_transceive_cb\n RET: %d\n", err);
    			/* CS line is active, ready to transceive data */
    		}
    		else
    		{
    			/* CS line is not active */
    			__asm__ volatile("nop");
    		}
    
    		if (err < 0)
    		{
    			printf("SPI transceive error: %d\n", err);
    		}
    	}

    Here is the callback:

    void spi_slave_callback(const struct device *dev, int result, void *data)
    {
    	// Check for errors in the result
    	if (result < 0)
    	{
    		printf("SPI transaction failed with error code %d\n", result);
    		return;
    	}
    
    	// Check if the buffer contains data
    	if (buffer == NULL || BUFFER_SIZE == 0)
    	{
    		printf("Buffer is empty or not initialized\n");
    		return;
    	}
    
    	// Print the received data
    	printf("Received data: ");
    	for (int i = 0; i < BUFFER_SIZE; i++)
    	{
    		printf("%02x ", buffer[i]);
    	}
    
    	printf("\n");
    
    	// Print the result of the SPI transaction
    	printf("SPI transaction completed with status %d\n", result);
    }

    Here is the console output:

    Out of spi_transceive_cb

     RET: 0

    [00:00:35.624,877] <dbg> mpu: mpu_configure_region: Configure MPU region at index 0x2

    [00:00:35.633,087] <dbg> mpu: region_allocate_and_init: Program MPU region at index 0x2

    [00:00:35.641,510] <dbg> mpu: region_init: [2] 0x200015c0 0x150b000a

  • More information.....

    I changed my code to operate similar to the master/slave SPI example that is referenced in various Nordic SPI threads: NCS spi master/slave example

    In particular, adding in the kpoll method to watch for spi transaction completion.  Here are a couple of code snippets:

    	k_poll_signal_reset(&spi_slave_done_sig);
    	__asm__ volatile("nop");
    	err = spi_transceive_cb(spi_dev, &spi_cfg, NULL, &rx, spi_slave_callback, &spi_slave_done_sig);
    	__asm__ volatile("nop");
    	printf("Out of spi_transceive_cb\n RET: %d\n", err);
    	return (err);
    
    .................
    
    			printf("waiting... ");
    			do
    			{
    				err = spi_slave_check_for_message();
    			    printf(".");
    			} while (err < 0);
    			printf("\n");
    			
    .......................
    
    static int spi_slave_check_for_message(void)
    {
    	int signaled, result;
    	k_poll_signal_check(&spi_slave_done_sig, &signaled, &result);
    	if (signaled != 0)
    	{
    		return 0;
    	}
    	else
    		return -1;
    }

    The code/device sits and waits for the cs line to drop.  Once that happens the kpoll reset occurs and spi_transceive_cb is called as shown.  Then the code goes into the do while loop to look for completion of the SPI reception.  The completion never occurs and the device keeps printing '.' 's to the console.  It doesn't matter if I underflow the transmission, have it match the buffer definition exactly (8 bytes) or overflow, the spi reception never 'completes'.  

    It seems as though I'm missing something very fundamental here.  Thank you in advance for any insights.

  • Hi, 

    I am not sure why it is happening like this, while the code looks pretty much same like the SPI Master/Slave Sample.

    Have you tested the sample? Can you start with that and then modify / incorporate the changes you want.

  • Ok, here are some interesting results.

    I started a new project and pulled in the files from the master/slave GitHub repository (including the proj.conf file).  Modify nothing, build, and flash.  I get a toggling LED, as expected from the code.  However, I can not see any of the printk messages.

    As soon as I modify the proj.conf file so that I can see the printk output, I start having issues.  Here is the output:

    [00:00:00.249,93[00:00:00.250,244] <dbg> mpu: region_init: [2] 0x20012000 0x150b000a
    SPI master/slave example started
    --- 37 messages dropped ---
    SPI SLAVE TX: 0x00, 0x00
    SPI TX: 0x00, 0x00
    [00:00:00.250,427] <dbg> spi_nrfx_spim: spi_context_buffers_setup: tx_bufs 0x20012fc8 - rx_bufs 0x20012fb8 - 1
    [00:00:00.250,457] <dbg> spi_nrfx_spim: spi_context_buffers_setup: current_tx 0x20012fd0 (1), current_rx 0x20012fc0 (1), tx buf/len 0x200007e4/2, rx buf/len 0x200007e0/2
    [00:00:00.250,488] <dbg> spi_nrfx_spim: spi_context_update_tx: tx buf/len (nil)/0
    [00:00:00.250,518] <dbg> spi_nrfx_spim: spi_context_update_rx: rx buf/len (nil)/0
    [00:00:00.250,549] <dbg> spi_nrfx_spim: finish_transaction: Transaction finished with status 0
    SPI RX: 0x00, 0x00
    [00:00:00.250,640] <dbg> os: z_tick_sleep: thread 0x20000600 for 32768 ticks
    [00:00:00.250,671] <dbg> mpu: z_arm_configure_dynamic_mpu_regions: configure thread 0x20000000's domain
    [00:00:00.250,701] <dbg> mpu: z_arm_configure_dynamic_mpu_regions: configure domain: 0x20001448
    [00:00:00.250,701] <dbg> mpu: z_arm_configure_dynamic_mpu_regions: configure domain: 0x20001448
    [00:00:00.250,732] <dbg> mpu: z_arm_configure_dynamic_mpu_regions: configure user thread 0x20000000's context
    [00:00:00.250,762] <dbg> mpu: mpu_configure_region: Configure MPU region at index 0x2
    [00:00:00.250,793] <dbg> mpu: region_allocate_and_init: Program MPU region at index 0x2
    [00:00:00.250,793] <dbg> mpu: region_init: [2] 0x20002000 0x150b000a
    [00:00:00.249,938] <dbg> mpu: mpu_configure_region: Configure MPU region at index 0x2
    [00:00:00.250,976] <err> os: ***** MPU FAULT *****
    [00:00:00.251,007] <err> os:   Data Access Violation
    [00:00:00.251,007] <err> os:   MMFAR Address: 0x20002010
    [00:00:00.251,037] <err> os: r0/a1:  0x200020e0  r1/a2:  0x0000001c  r2/a3:  0x00000000
    [00:00:00.251,068] <err> os: r3/a4:  0x20002094 r12/ip:  0x0000000e r14/lr:  0x0000258f
    [00:00:00.251,068] <err> os:  xpsr:  0x01000000
    [00:00:00.251,098] <err> os: Faulting instruction address (r15/pc): 0x00000bda
    [00:00:00.251,159] <err> os: >>> ZEPHYR FATAL ERROR 2: Stack overflow on CPU 0
    [00:00:00.251,190] <err> os: Current thread: 0x20000000 (logging)
    [00:00:01.086,059] <err> os: Halting system

    Here is the modified proj.conf file:

    CONFIG_GPIO=y
    
    CONFIG_SPI=y
    CONFIG_SPI_ASYNC=y
    
    CONFIG_SPI_SLAVE=y
    
    CONFIG_DEBUG=y
    CONFIG_PRINTK=y
    #CONFIG_NRFX_SPIS1=y
    CONFIG_USERSPACE=y
    CONFIG_UART_CONSOLE=n
    CONFIG_LOG=y
    CONFIG_LOG_BACKEND_RTT=y
    CONFIG_LOG_BACKEND_UART=n
    CONFIG_LOG_PRINTK=y
    CONFIG_LOG_DEFAULT_LEVEL=4 
    CONFIG_USE_SEGGER_RTT=y
    CONFIG_RTT_CONSOLE=y
    CONFIG_SERIAL=y
    
    CONFIG_HEAP_MEM_POOL_SIZE=50512
    CONFIG_IDLE_STACK_SIZE=4096
    CONFIG_SYSTEM_WORKQUEUE_STACK_SIZE=4096
    CONFIG_MAIN_STACK_SIZE=4096

    I had also tried a version to route the console to the UART, but was still not seeing output (am connected to UART0, UART0 is enabled and connected to the console per the dts file, UART1 is disabled per the overlay).

Related