Connection failure error during DFU over Matter guide

Hi

I have a question because a connection failure error occurred during the DFU over Matter guide.

- guide URL : developer.nordicsemi.com/.../nrfconnect_examples_software_update.html

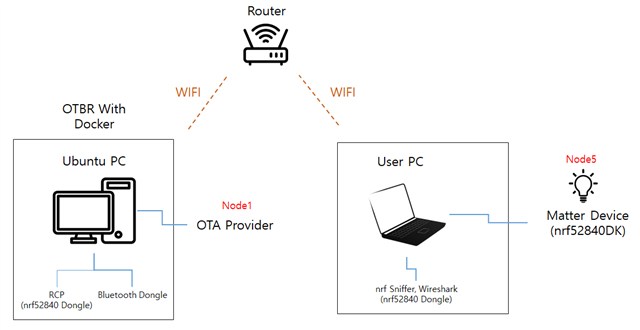
The PC using Ubuntu OS(with nRF52840 dongle) is configured as the OTA provider and the nRF52840DK board is configured as the OTA requester.

I completed the installation of ota-provider-app and chip-tool on the Linux PC and commissioned the Linux PC as an OTA provider through the command below

./out/chiptool/chip-tool pairing onnetwork 1 20202021

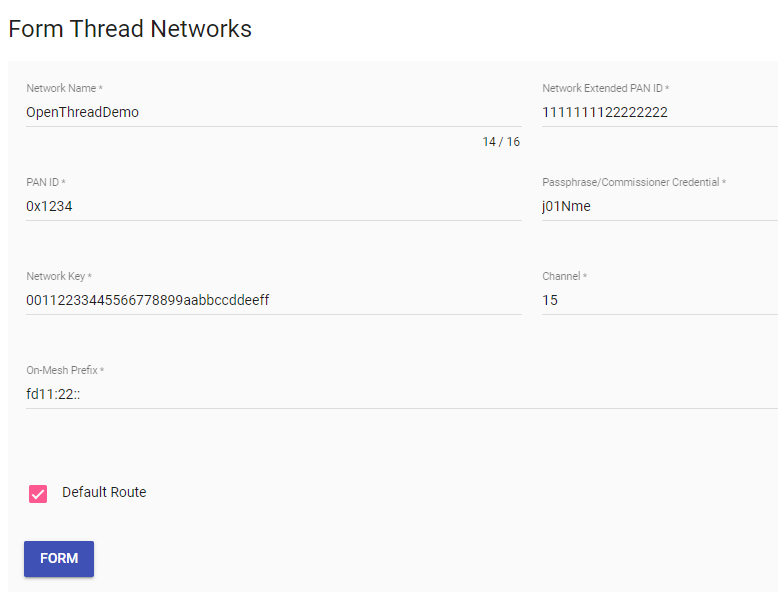
And after configuring the new thread network through OTBR, nRF52840DK board was commissioned with node ID 2.

./out/chiptool/chip-tool pairing ble-thread 2 hex:0e08000000000001000035060004001fffe00708fdb96028cd2611df0c0402a0f7f8051000112233445566778899aabbccddeeff030
e4f70656e54687265616444656d6f0410445f2b5ca6f2a93a55ce570a70efeecb000300000f0208111111112222222201021234 20202021 3840

Finally, I performed the steps 8 and 9 commands.

./out/chiptool/chip-tool otasoftwareupdaterequestor write default-otaproviders '[{"fabricIndex": 1, "providerNodeID": 1, "endpoint": 0}]' 2 0

('default-ota-providers' command did not exist, so we used 'default-otaproviders')

./out/chiptool/chip-tool accesscontrol write acl '[{"fabricIndex": 1, "privilege": 5, "authMode": 2, "subjects": [112233], "targets": null}, {"fabricIndex": 1, "privilege": 3, "authMode": 2, "subjects": null, "targets": null}]' 1 0


And I sent Announce OTA Provider command using Chip tool, but an error appears in the nRF52840DK board log

./out/chiptool/chip-tool otasoftwareupdaterequestor announce-otaprovider 1 0 0 0 2 0

('announce-ota-provider' command did not exist, so we used 'announce-ota-provider')

Log >>

I: 1515622 [EM]>>> [E:60665r S:0 M:182234332] (U) Msg RX from 0:EBA082CFD0009BF0 [0000] --- Type 0000:30 (SecureChannel:CASE_Sigma1)
I: 1515634 [IN]CASE Server received Sigma1 message . Starting handshake. EC 0x20004e60
I: 1515641 [IN]CASE Server disabling CASE session setups
I: 1515647 [EM]<<< [E:60665r S:0 M:209788448 (Ack:182234332)] (U) Msg TX to 0:0000000000000000 [0000] --- Type 0000:10 (SecureChannel:StandaloneAck)
I: 1515660 [IN](U) Sending msg 209788448 to IP address 'UDP:[fd11:db8:1::1]:46385'
I: 1515668 [SC]Received Sigma1 msg
I: 1515676 [SC]CASE matched destination ID: fabricIndex 1, NodeID 0x0000000000000002
I: 1515885 [EM]<<< [E:60665r S:0 M:209788449 (Ack:182234332)] (U) Msg TX to 0:0000000000000000 [0000] --- Type 0000:31 (SecureChannel:CASE_Sigma2)
I: 1515898 [IN](U) Sending msg 209788449 to IP address 'UDP:[fd11:db8:1::1]:46385'
I: 1515907 [SC]Sent Sigma2 msg
I: 1516027 [EM]>>> [E:60665r S:0 M:182234333 (Ack:209788449)] (U) Msg RX from 0:EBA082CFD0009BF0 [0000] --- Type 0000:32 (SecureChannel:CASE_Sigma3)
I: 1516040 [EM]<<< [E:60665r S:0 M:209788450 (Ack:182234333)] (U) Msg TX to 0:0000000000000000 [0000] --- Type 0000:10 (SecureChannel:StandaloneAck)
I: 1516053 [IN](U) Sending msg 209788450 to IP address 'UDP:[fd11:db8:1::1]:46385'
I: 1516062 [SC]Received Sigma3 msg
E: 1516070 [SC]The device does not support GetClock_RealTimeMS() API: 3. Falling back to Last Known Good UTC Time
E: 1516267 [DL]Long dispatch time: 187 ms, for event type 2
I: 1516368 [EM]<<< [E:60665r S:0 M:209788451 (Ack:182234333)] (U) Msg TX to 0:0000000000000000 [0000] --- Type 0000:40 (SecureChannel:StatusReport)
I: 1516381 [IN](U) Sending msg 209788451 to IP address 'UDP:[fd11:db8:1::1]:46385'
I: 1516391 [SC]SecureSession[0x20003838]: Moving from state 'kEstablishing' --> 'kActive'
D: 1516400 [IN]SecureSession[0x20003838]: Activated - Type:2 LSID:38704
D: 1516406 [IN]New secure session activated for device <000000000001B669, 1>, LSID:38704 PSID:14355!
I: 1516419 [IN]CASE Session established to peer: <000000000001B669, 1>
I: 1516425 [IN]CASE Server enabling CASE session setups
D: 1516431 [IN]SecureSession[0x200038f0]: Allocated Type:2 LSID:38706
E: 1516437 [DL]Long dispatch time: 165 ms, for event type 2
I: 1516443 [EM]>>> [E:60666r S:38704 M:131944375] (S) Msg RX from 1:000000000001B669 [4661] --- Type 0001:08 (IM:InvokeCommandRequest)
I: 1516456 [SWU]OTA Requestor received AnnounceOTAProvider
D: 1516461 [SWU] FabricIndex: 1
D: 1516464 [SWU] ProviderNodeID: 0x0000000000000001
D: 1516469 [SWU] VendorID: 0x0
D: 1516472 [SWU] AnnouncementReason: 0
D: 1516475 [SWU] Endpoint: 0
I: 1516479 [EM]<<< [E:60666r S:38704 M:3219666 (Ack:131944375)] (S) Msg TX to 1:000000000001B669 [4661] --- Type 0001:09 (IM:InvokeCommandResponse)
I: 1516492 [IN](S) Sending msg 3219666 on secure session with LSID: 38704
I: 1516500 [EM]>>> [E:60665r S:0 M:182234334 (Ack:209788451)] (U) Msg RX from 0:EBA082CFD0009BF0 [0000] --- Type 0000:10 (SecureChannel:StandaloneAck)
I: 1516514 [SWU]Stopping the Periodic Query timer
I: 1516519 [SWU]Starting the watchdog timer, timeout: 21600 seconds
D: 1516525 [SWU]Establishing session to provider node ID 0x0000000000000001 on fabric index 1
D: 1516535 [DIS]OperationalSessionSetup[1:0000000000000001]: State change 1 --> 2
I: 1516543 [DIS]Resolving DFAABB27E9334661:0000000000000001 ...
I: 1516551 [EM]>>> [E:60666r S:38704 M:131944376 (Ack:3219666)] (S) Msg RX from 1:000000000001B669 [4661] --- Type 0000:10 (SecureChannel:StandaloneAck)
I: 1516635 [DIS]Node ID resolved for DFAABB27E9334661:0000000000000001
D: 1516641 [DIS] Hostname: E0D55EB9F3140000
D: 1516645 [DIS] IP Address #1: fd11:db8:1::1
D: 1516649 [DIS] Port: 5540
D: 1516652 [DIS] Mrp Interval idle: 300 ms
D: 1516656 [DIS] Mrp Interval active: 2000 ms
D: 1516660 [DIS] TCP Supported: 1
D: 1516663 [DIS]Lookup clearing interface for non LL address
I: 1516668 [DIS]UDP:[fd11:db8:1::1]:5540: new best score: 4
I: 1516674 [DIS]Checking node lookup status after 131 ms
I: 1516679 [DIS]Keeping DNSSD lookup active
I: 1516743 [DIS]Checking node lookup status after 200 ms
D: 1516748 [DIS]OperationalSessionSetup[1:0000000000000001]: Updating device address to UDP:[fd11:db8:1::1]:5540 while in state 2
D: 1516760 [DIS]OperationalSessionSetup[1:0000000000000001]: State change 2 --> 3
D: 1516767 [IN]SecureSession[0x200039a8]: Allocated Type:2 LSID:38707
I: 1516774 [SC]Initiating session on local FabricIndex 1 from 0x0000000000000002 -> 0x0000000000000001
I: 1516924 [EM]<<< [E:31162i S:0 M:209788452] (U) Msg TX to 0:0000000000000000 [0000] --- Type 0000:30 (SecureChannel:CASE_Sigma1)
I: 1516936 [IN](U) Sending msg 209788452 to IP address 'UDP:[fd11:db8:1::1]:5540'
I: 1516944 [SC]Sent Sigma1 msg
D: 1516947 [DIS]OperationalSessionSetup[1:0000000000000001]: State change 3 --> 4
I: 1517852 [IN](U) Sending msg 209788452 to IP address 'UDP:[fd11:db8:1::1]:5540'
I: 1518686 [IN](U) Sending msg 209788452 to IP address 'UDP:[fd11:db8:1::1]:5540'
I: 1519741 [IN](U) Sending msg 209788452 to IP address 'UDP:[fd11:db8:1::1]:5540'
I: 1521217 [IN](U) Sending msg 209788452 to IP address 'UDP:[fd11:db8:1::1]:5540'
E: 1523365 [EM]Failed to Send CHIP MessageCounter:209788452 on exchange 31162i sendCount: 4 max retries: 4
E: 1525648 [SC]CASESession timed out while waiting for a response from the peer. Current state was 1
D: 1525657 [IN]SecureSession[0x200039a8]: Released - Type:2 LSID:38707
D: 1525664 [DIS]OperationalSessionSetup[1:0000000000000001]: State change 4 --> 2
D: 1525671 [DIS]OperationalSessionSetup[1:0000000000000001]: State change 2 --> 1
E: 1525679 [SWU]Failed to connect to node 0x0000000000000001: 32
I: 1525686 [SWU]Unknown idle state reason so set the periodic timer for a next attempt
I: 1525694 [SWU]Stopping the watchdog timer
I: 1525698 [SWU]Starting the periodic query timer, timeout: 86400 seconds

When you send the Query command from the nRF52840DK board, the error log appears as shown below.

matter ota query

Log >>
matter ota query
uart:~$ I: 1682151 [SWU]Triggered immediate OTA query for fabric: 0x1
I: 1682159 [SWU]Stopping the Periodic Query timer
I: 1682163 [SWU]Starting the watchdog timer, timeout: 21600 seconds
D: 1682169 [SWU]Establishing session to provider node ID 0x0000000000000001 on fabric index 1
D: 1682177 [DIS]OperationalSessionSetup[1:0000000000000001]: State change 1 --> 2
I: 1682185 [DIS]Resolving DFAABB27E9334661:0000000000000001 ...
I: 1682284 [DIS]Node ID resolved for DFAABB27E9334661:0000000000000001
D: 1682290 [DIS] Hostname: E0D55EB9F3140000
D: 1682294 [DIS] IP Address #1: fd11:db8:1::1
D: 1682298 [DIS] Port: 5540
D: 1682301 [DIS] Mrp Interval idle: 300 ms
D: 1682305 [DIS] Mrp Interval active: 2000 ms
D: 1682309 [DIS] TCP Supported: 1
D: 1682312 [DIS]Lookup clearing interface for non LL address
I: 1682317 [DIS]UDP:[fd11:db8:1::1]:5540: new best score: 4
I: 1682323 [DIS]Checking node lookup status after 138 ms
I: 1682328 [DIS]Keeping DNSSD lookup active
I: 1682385 [DIS]Checking node lookup status after 200 ms
D: 1682390 [DIS]OperationalSessionSetup[1:0000000000000001]: Updating device address to UDP:[fd11:db8:1::1]:5540 while in state 2
D: 1682402 [DIS]OperationalSessionSetup[1:0000000000000001]: State change 2 --> 3
D: 1682409 [IN]SecureSession[0x200039a8]: Allocated Type:2 LSID:38709
I: 1682416 [SC]Initiating session on local FabricIndex 1 from 0x0000000000000002 -> 0x0000000000000001
I: 1682567 [EM]<<< [E:31164i S:0 M:209788454] (U) Msg TX to 0:0000000000000000 [0000] --- Type 0000:30 (SecureChannel:CASE_Sigma1)
I: 1682578 [IN](U) Sending msg 209788454 to IP address 'UDP:[fd11:db8:1::1]:5540'
I: 1682587 [SC]Sent Sigma1 msg
D: 1682590 [DIS]OperationalSessionSetup[1:0000000000000001]: State change 3 --> 4
I: 1683417 [IN](U) Sending msg 209788454 to IP address 'UDP:[fd11:db8:1::1]:5540'
I: 1684297 [IN](U) Sending msg 209788454 to IP address 'UDP:[fd11:db8:1::1]:5540'
I: 1685441 [IN](U) Sending msg 209788454 to IP address 'UDP:[fd11:db8:1::1]:5540'
I: 1686890 [IN](U) Sending msg 209788454 to IP address 'UDP:[fd11:db8:1::1]:5540'
E: 1688790 [EM]Failed to Send CHIP MessageCounter:209788454 on exchange 31164i sendCount: 4 max retries: 4
E: 1691290 [SC]CASESession timed out while waiting for a response from the peer. Current state was 1
D: 1691299 [IN]SecureSession[0x200039a8]: Released - Type:2 LSID:38709
D: 1691305 [DIS]OperationalSessionSetup[1:0000000000000001]: State change 4 --> 2
D: 1691313 [DIS]OperationalSessionSetup[1:0000000000000001]: State change 2 --> 1
E: 1691320 [SWU]Failed to connect to node 0x0000000000000001: 32
I: 1691327 [SWU]Unknown idle state reason so set the periodic timer for a next attempt
I: 1691334 [SWU]Stopping the watchdog timer
I: 1691338 [SWU]Starting the periodic query timer, timeout: 86400 seconds

How can I solve this problem?

Also, could you check if DFU over Matter works well with the contents of the above guide Url?

+) The example "ncs\v2.4.0\nrf\samples\matter\light_bulb" was used, and only 'CONFIG_CHIP_DFU_OVER_BT_SMP=y' was added to the prj.conf file.

Parents
  • Hi,

    What are you running the OTBR on, and are you running it in docker mode or manually?

    Are you able to communicate with both the nRF52840 DK and OTA provider on the Matter network, and is the computer with the OTA provider on the same Wi-Fi network as the OTBR?

    Best regards,
    Marte

  • Yes, OTBR is running in docker mode and has been confirmed to communicate with the nRF52840DK with the Led onoff toggle command. They are all on the same WIFI network. 


    <OTA provider>                                         <OTA Requestor>

    | PC(ubuntu)             |                              | nRF52840DK        |
    | nRF52840 Dongle  |          <----->    

    It has also been confirmed that both Node1 (OTA provider) and Node2 (OTA requester) work using Chip tool on Linux PCs (read Vender id or Product id...etc)

  • Thank you for providing the logs!

    bluemelony said:

    If it consists of only OTA ProviderAPP and OTA Requestor, it seems that OTA can be tested without OTBR. It this for real?

    I will ask the developers about this

    bluemelony said:

    I don't know how to check 802.15.4 Sniffer using WireShark....Disappointed relieved.

    If you explain the part in detail again, I will let you know the results of the confirmation.

    No worries! Here's a couple of links that will take you through how to do that https://www.nordicsemi.com/Products/Development-tools/nrf-sniffer-for-802154 and https://infocenter.nordicsemi.com/index.jsp?topic=%2Fug_sniffer_802154%2FUG%2Fsniffer_802154%2Fintro_802154.html

    If you don't have a nRF52840 dongle available, you can always use one of your nRF52840dks instead

    PS: A tip for attaching the logs is to use the code snippet function found under insert to make the case more manageable to scroll through! :) I will go through your replies now and edit them into boxes for you but for future logs and attachment that will really improve readability of your case

  • One more thing.

    With OTBR, OTA Provider, and Matter Device (nrf52840dk) all configured as above, when Matter Device is rebooted, the following log appears immediately on the OTA Provider. What does this mean?

    [1687855637.419277][5148:5148] CHIP:DIS: SRV record already actively processed.
    [1687855637.419364][5148:5148] CHIP:DIS: SRV record already actively processed.
    [1687855637.419509][5148:5148] CHIP:DIS: SRV record already actively processed.
    [1687855637.419534][5148:5148] CHIP:DIS: SRV record already actively processed.
    [1687855637.420811][5148:5148] CHIP:DIS: SRV record already actively processed.
    [1687855637.420841][5148:5148] CHIP:DIS: SRV record already actively processed.
    [1687855637.420965][5148:5148] CHIP:DIS: SRV record already actively processed.
    [1687855637.420984][5148:5148] CHIP:DIS: SRV record already actively processed.

    ...

    ...

  • Hello!

    We did nRF Sniffer Capture based on the WireShark setting guide you answered.

    First of all, it is a capture when the Onoff toggle command is delivered to Matter Device (nRF52840DK) in the

    above situation.

    sudo ./out/chiptool/chip-tool onoff toggle 10 1

    (sorry, I don't know if it's all set up correctly...

    and I don't know how to extract it, so sending a raw capture file..Disappointed relieved)

    Cp1.pcapng


    Next, the behavior for the Provider

    * OTA file set : sudo ./out/provider/chip-ota-provider-app -f matter.ota,

    * Provider pairing : sudo ./out/chiptool/chip-tool pairing onnetwork-long 5 20202021 3840,

    * OTA request : sudo ./out/chiptool/chip-tool otasoftwareupdaterequestor announce-otaprovider 5 0 0 0 10 0

    did not show any packets..


    No packets of content appeared in Wireshark except packets coming out of OTBR continuously.

    This makes me suspect that the OTA Provider app is not behaving incorrectly.

  • Hi,

    I brought your results to the Matter team and this is what they had to say:

    The info that no packets were captured after invoking announce-otaprovider command made me become super suspicious, as it's very unlikely to happen.

    1. They think that the you have invoked the commands correctly, at least at first as they can see in your first post that pairing for the DK, pairing for the OTA provider, write default ota providers, write acls and announce ota provider, but then in the following attempts the flow is not complete (e.g. here:
      1. OTA file set : sudo ./out/provider/chip-ota-provider-app -f matter.ota
      2. Provider pairing : sudo ./out/chiptool/chip-tool pairing onnetwork-long 5 20202021 3840
      3. OTA request : sudo ./out/chiptool/chip-tool otasoftwareupdaterequestor announce-otaprovider 5 0 0 0 10 0

        I don't see setting acls and default-otaprovider. They assume that you have done it correctly and the presented example is just simplified, but just to make sure, could you verify if the proper flow was used?

    2. Regarding that no packets of content appeared in Wireshark except packets coming out of OTBR continuously. This makes me suspect that the OTA Provider app is not behaving incorrectly.

      The commands sent from CHIP Tool to OTA provider will not be visible in the wireshark, because it sniffs the Thread traffic, and these commands are sent over Wi-Fi (because both CHIP Tool and OTA provider are working on Wi-Fi). What should be visible is traffic between CHIP Tool <-> DK and also DK <-> OTA Provider.

      Could you check if you're able to narrow down the issue by verifying if you're able to observe the traffic that should be visible?

    3. They would also attempt to try the setup once more from scratch (the best option would be to reset everything), then connect the Wireshark and repeat all the steps. Please be careful and observe the packets and logs displayed after every invoked command.

      Especially pay attention to this one: chip-tool otasoftwareupdaterequestor announce-otaprovider 5 0 0 0 10 0

      They are expecting that the DK should a log about trying to send Sigma 1 message: I: 1682587 [SC]Sent Sigma1 msg

      and also the packets should appear in wireshark just after that. It's almost impossible that after displaying such a log the corresponding packets didn't appear in the Wireshark (the only case they could imagine is that the radio signal was too low and the sniffer didn't capture it).

      I know that may be a lot of work, but if you're able to recreate the issue by following the guides once more, then we can with more certainty state that it might be a bug and not due to missing one step at an earlier step

    Let me know about this and I'll bring it back to the Matter team if this does not resolve the issue! 

    Kind regards,
    Andreas

  • Hi

    Thank you for your reply.

    This is the result of checking the 3 items you requested.


    1. Previously, the acls and default-otaprovider commands were also performed, and the results were the same.

    "./out/chiptool/chip-tool otasoftwareupdaterequestor write default-ota-providers '[{"fabricIndex": 1, "providerNodeID": 5, "endpoint": 0}]' 10 0"  ---> Packets checked in Wireshark

    "./out/chiptool/chip-tool accesscontrol write acl '[{"fabricIndex": 1, "privilege": 5, "authMode": 2, "subjects": [112233], "targets": null}, {"fabricIndex": 1, "privilege": 3, "authMode": 2, "subjects": null, "targets": null}]' 5 0" ----> No response to Wireshark

     And in OTA announce, we checked incorrectly and the packet was seen in Wireshark. The details of the packet are in number 3 below.


    2. I will check the contents again using Wireshark and send it to you.


    3. We repeated the same configuration from the beginning (from Matter Build and OTBR configuration) using a different PC, but the same situation continued.

    Additionally, we are sending you a full capture of Wireshark packets that occurred while proceeding

    with the Matter OTA guide document.

    (OTA Provider build ~ OTA announce, The OTA Provider Node is 1, and the Matter Device

    ,nRF52840DK Node is 2.)

    (https://developer.nordicsemi.com/nRF_Connect_SDK/doc/latest/matter/nrfconnect_examples_software_update.html)

    Cp2.pcapng

    And below is the DK side log that occurred during OTA Provider announce operation.

    I: 387185 [EM]>>> [E:34109r S:0 M:104490976] (U) Msg RX from 0:2326305E0017DBA6 [0000] --- Type 0000:30 (SecureChannel:CASE_Sigma1)
    I: 387197 [IN]CASE Server received Sigma1 message . Starting handshake. EC 0x20004e60
    I: 387205 [IN]CASE Server disabling CASE session setups
    I: 387210 [EM]<<< [E:34109r S:0 M:220107179 (Ack:104490976)] (U) Msg TX to 0:0000000000000000 [0000] --- Type 0000:10 (SecureChannel:StandaloneAck)
    I: 387223 [IN](U) Sending msg 220107179 to IP address 'UDP:[fd11:db8:1::1]:48082'
    I: 387231 [SC]Received Sigma1 msg
    I: 387239 [SC]CASE matched destination ID: fabricIndex 1, NodeID 0x0000000000000002
    I: 387454 [EM]<<< [E:34109r S:0 M:220107180 (Ack:104490976)] (U) Msg TX to 0:0000000000000000 [0000] --- Type 0000:31 (SecureChannel:CASE_Sigma2)
    I: 387467 [IN](U) Sending msg 220107180 to IP address 'UDP:[fd11:db8:1::1]:48082'
    I: 387476 [SC]Sent Sigma2 msg
    I: 387601 [EM]>>> [E:34109r S:0 M:104490977 (Ack:220107180)] (U) Msg RX from 0:2326305E0017DBA6 [0000] --- Type 0000:32 (SecureChannel:CASE_Sigma3)
    I: 387614 [EM]<<< [E:34109r S:0 M:220107181 (Ack:104490977)] (U) Msg TX to 0:0000000000000000 [0000] --- Type 0000:10 (SecureChannel:StandaloneAck)
    I: 387627 [IN](U) Sending msg 220107181 to IP address 'UDP:[fd11:db8:1::1]:48082'
    I: 387636 [SC]Received Sigma3 msg
    E: 387644 [SC]The device does not support GetClock_RealTimeMS() API: 3.  Falling back to Last Known Good UTC Time
    E: 387841 [DL]Long dispatch time: 187 ms, for event type 2
    I: 387944 [EM]<<< [E:34109r S:0 M:220107182 (Ack:104490977)] (U) Msg TX to 0:0000000000000000 [0000] --- Type 0000:40 (SecureChannel:StatusReport)
    I: 387957 [IN](U) Sending msg 220107182 to IP address 'UDP:[fd11:db8:1::1]:48082'
    I: 387967 [SC]SecureSession[0x200039a8]: Moving from state 'kEstablishing' --> 'kActive'
    D: 387975 [IN]SecureSession[0x200039a8]: Activated - Type:2 LSID:55573
    D: 387982 [IN]New secure session activated for device <000000000001B669, 1>, LSID:55573 PSID:31464!
    I: 387991 [IN]CASE Session established to peer: <000000000001B669, 1>
    I: 388000 [IN]CASE Server enabling CASE session setups
    D: 388007 [IN]SecureSession[0x20003a60]: Allocated Type:2 LSID:55575
    E: 388013 [DL]Long dispatch time: 167 ms, for event type 2
    I: 388019 [EM]>>> [E:34110r S:55573 M:214202345] (S) Msg RX from 1:000000000001B669 [3829] --- Type 0001:08 (IM:InvokeCommandRequest)
    I: 388032 [SWU]OTA Requestor received AnnounceOTAProvider
    D: 388037 [SWU]  FabricIndex: 1
    D: 388040 [SWU]  ProviderNodeID: 0x0000000000000001
    D: 388044 [SWU]  VendorID: 0x0
    D: 388047 [SWU]  AnnouncementReason: 0
    D: 388051 [SWU]  Endpoint: 0
    I: 388054 [EM]<<< [E:34110r S:55573 M:166002962 (Ack:214202345)] (S) Msg TX to 1:000000000001B669 [3829] --- Type 0001:09 (IM:InvokeCommandResponse)
    I: 388067 [IN](S) Sending msg 166002962 on secure session with LSID: 55573
    I: 388076 [EM]>>> [E:34109r S:0 M:104490978 (Ack:220107182)] (U) Msg RX from 0:2326305E0017DBA6 [0000] --- Type 0000:10 (SecureChannel:StandaloneAck)
    I: 388093 [SWU]Stopping the Periodic Query timer
    I: 388097 [SWU]Starting the watchdog timer, timeout: 21600 seconds
    D: 388103 [SWU]Establishing session to provider node ID 0x0000000000000001 on fabric index 1
    D: 388111 [DIS]OperationalSessionSetup[1:0000000000000001]: State change 1 --> 2
    I: 388119 [DIS]Resolving 5F72E24097313829:0000000000000001 ...
    I: 388127 [EM]>>> [E:34110r S:55573 M:214202346 (Ack:166002962)] (S) Msg RX from 1:000000000001B669 [3829] --- Type 0000:10 (SecureChannel:StandaloneAck)
    I: 388280 [DIS]Node ID resolved for 5F72E24097313829:0000000000000001
    D: 388286 [DIS] Hostname: E0D55EB9F3140000
    D: 388290 [DIS] IP Address #1: fd11:db8:1::1
    D: 388294 [DIS] Port: 5540
    D: 388296 [DIS] Mrp Interval idle: 300 ms
    D: 388300 [DIS] Mrp Interval active: 2000 ms
    D: 388304 [DIS] TCP Supported: 1
    D: 388307 [DIS]Lookup clearing interface for non LL address
    I: 388313 [DIS]UDP:[fd11:db8:1::1]:5540: new best score: 4
    I: 388318 [DIS]Checking node lookup status after 200 ms
    D: 388323 [DIS]OperationalSessionSetup[1:0000000000000001]: Updating device address to UDP:[fd11:db8:1::1]:5540 while in state 2
    D: 388334 [DIS]OperationalSessionSetup[1:0000000000000001]: State change 2 --> 3
    D: 388342 [IN]SecureSession[0x20003b18]: Allocated Type:2 LSID:55576
    I: 388348 [SC]Initiating session on local FabricIndex 1 from 0x0000000000000002 -> 0x0000000000000001
    I: 388503 [EM]<<< [E:34040i S:0 M:220107183] (U) Msg TX to 0:0000000000000000 [0000] --- Type 0000:30 (SecureChannel:CASE_Sigma1)
    I: 388514 [IN](U) Sending msg 220107183 to IP address 'UDP:[fd11:db8:1::1]:5540'
    I: 388523 [SC]Sent Sigma1 msg
    D: 388526 [DIS]OperationalSessionSetup[1:0000000000000001]: State change 3 --> 4
    E: 388534 [DL]Long dispatch time: 254 ms, for event type 2
    I: 389382 [IN](U) Sending msg 220107183 to IP address 'UDP:[fd11:db8:1::1]:5540'
    I: 390270 [IN](U) Sending msg 220107183 to IP address 'UDP:[fd11:db8:1::1]:5540'
    I: 391303 [IN](U) Sending msg 220107183 to IP address 'UDP:[fd11:db8:1::1]:5540'
    I: 392829 [IN](U) Sending msg 220107183 to IP address 'UDP:[fd11:db8:1::1]:5540'
    E: 394901 [EM]Failed to Send CHIP MessageCounter:220107183 on exchange 34040i sendCount: 4 max retries: 4
    E: 397226 [SC]CASESession timed out while waiting for a response from the peer. Current state was 1
    D: 397235 [IN]SecureSession[0x20003b18]: Released - Type:2 LSID:55576
    D: 397242 [DIS]OperationalSessionSetup[1:0000000000000001]: State change 4 --> 2
    D: 397249 [DIS]OperationalSessionSetup[1:0000000000000001]: State change 2 --> 1
    E: 397256 [SWU]Failed to connect to node 0x0000000000000001: 32
    I: 397263 [SWU]Unknown idle state reason so set the periodic timer for a next attempt
    I: 397271 [SWU]Stopping the watchdog timer
    I: 397275 [SWU]Starting the periodic query timer, timeout: 86400 seconds

    as you can see "I: 388523 [SC]Sent Sigma1 msg" Log is confirmed.


    I hope this information is helpful.Smile

    If you need additional information, please request it. 

Reply
  • Hi

    Thank you for your reply.

    This is the result of checking the 3 items you requested.


    1. Previously, the acls and default-otaprovider commands were also performed, and the results were the same.

    "./out/chiptool/chip-tool otasoftwareupdaterequestor write default-ota-providers '[{"fabricIndex": 1, "providerNodeID": 5, "endpoint": 0}]' 10 0"  ---> Packets checked in Wireshark

    "./out/chiptool/chip-tool accesscontrol write acl '[{"fabricIndex": 1, "privilege": 5, "authMode": 2, "subjects": [112233], "targets": null}, {"fabricIndex": 1, "privilege": 3, "authMode": 2, "subjects": null, "targets": null}]' 5 0" ----> No response to Wireshark

     And in OTA announce, we checked incorrectly and the packet was seen in Wireshark. The details of the packet are in number 3 below.


    2. I will check the contents again using Wireshark and send it to you.


    3. We repeated the same configuration from the beginning (from Matter Build and OTBR configuration) using a different PC, but the same situation continued.

    Additionally, we are sending you a full capture of Wireshark packets that occurred while proceeding

    with the Matter OTA guide document.

    (OTA Provider build ~ OTA announce, The OTA Provider Node is 1, and the Matter Device

    ,nRF52840DK Node is 2.)

    (https://developer.nordicsemi.com/nRF_Connect_SDK/doc/latest/matter/nrfconnect_examples_software_update.html)

    Cp2.pcapng

    And below is the DK side log that occurred during OTA Provider announce operation.

    I: 387185 [EM]>>> [E:34109r S:0 M:104490976] (U) Msg RX from 0:2326305E0017DBA6 [0000] --- Type 0000:30 (SecureChannel:CASE_Sigma1)
    I: 387197 [IN]CASE Server received Sigma1 message . Starting handshake. EC 0x20004e60
    I: 387205 [IN]CASE Server disabling CASE session setups
    I: 387210 [EM]<<< [E:34109r S:0 M:220107179 (Ack:104490976)] (U) Msg TX to 0:0000000000000000 [0000] --- Type 0000:10 (SecureChannel:StandaloneAck)
    I: 387223 [IN](U) Sending msg 220107179 to IP address 'UDP:[fd11:db8:1::1]:48082'
    I: 387231 [SC]Received Sigma1 msg
    I: 387239 [SC]CASE matched destination ID: fabricIndex 1, NodeID 0x0000000000000002
    I: 387454 [EM]<<< [E:34109r S:0 M:220107180 (Ack:104490976)] (U) Msg TX to 0:0000000000000000 [0000] --- Type 0000:31 (SecureChannel:CASE_Sigma2)
    I: 387467 [IN](U) Sending msg 220107180 to IP address 'UDP:[fd11:db8:1::1]:48082'
    I: 387476 [SC]Sent Sigma2 msg
    I: 387601 [EM]>>> [E:34109r S:0 M:104490977 (Ack:220107180)] (U) Msg RX from 0:2326305E0017DBA6 [0000] --- Type 0000:32 (SecureChannel:CASE_Sigma3)
    I: 387614 [EM]<<< [E:34109r S:0 M:220107181 (Ack:104490977)] (U) Msg TX to 0:0000000000000000 [0000] --- Type 0000:10 (SecureChannel:StandaloneAck)
    I: 387627 [IN](U) Sending msg 220107181 to IP address 'UDP:[fd11:db8:1::1]:48082'
    I: 387636 [SC]Received Sigma3 msg
    E: 387644 [SC]The device does not support GetClock_RealTimeMS() API: 3.  Falling back to Last Known Good UTC Time
    E: 387841 [DL]Long dispatch time: 187 ms, for event type 2
    I: 387944 [EM]<<< [E:34109r S:0 M:220107182 (Ack:104490977)] (U) Msg TX to 0:0000000000000000 [0000] --- Type 0000:40 (SecureChannel:StatusReport)
    I: 387957 [IN](U) Sending msg 220107182 to IP address 'UDP:[fd11:db8:1::1]:48082'
    I: 387967 [SC]SecureSession[0x200039a8]: Moving from state 'kEstablishing' --> 'kActive'
    D: 387975 [IN]SecureSession[0x200039a8]: Activated - Type:2 LSID:55573
    D: 387982 [IN]New secure session activated for device <000000000001B669, 1>, LSID:55573 PSID:31464!
    I: 387991 [IN]CASE Session established to peer: <000000000001B669, 1>
    I: 388000 [IN]CASE Server enabling CASE session setups
    D: 388007 [IN]SecureSession[0x20003a60]: Allocated Type:2 LSID:55575
    E: 388013 [DL]Long dispatch time: 167 ms, for event type 2
    I: 388019 [EM]>>> [E:34110r S:55573 M:214202345] (S) Msg RX from 1:000000000001B669 [3829] --- Type 0001:08 (IM:InvokeCommandRequest)
    I: 388032 [SWU]OTA Requestor received AnnounceOTAProvider
    D: 388037 [SWU]  FabricIndex: 1
    D: 388040 [SWU]  ProviderNodeID: 0x0000000000000001
    D: 388044 [SWU]  VendorID: 0x0
    D: 388047 [SWU]  AnnouncementReason: 0
    D: 388051 [SWU]  Endpoint: 0
    I: 388054 [EM]<<< [E:34110r S:55573 M:166002962 (Ack:214202345)] (S) Msg TX to 1:000000000001B669 [3829] --- Type 0001:09 (IM:InvokeCommandResponse)
    I: 388067 [IN](S) Sending msg 166002962 on secure session with LSID: 55573
    I: 388076 [EM]>>> [E:34109r S:0 M:104490978 (Ack:220107182)] (U) Msg RX from 0:2326305E0017DBA6 [0000] --- Type 0000:10 (SecureChannel:StandaloneAck)
    I: 388093 [SWU]Stopping the Periodic Query timer
    I: 388097 [SWU]Starting the watchdog timer, timeout: 21600 seconds
    D: 388103 [SWU]Establishing session to provider node ID 0x0000000000000001 on fabric index 1
    D: 388111 [DIS]OperationalSessionSetup[1:0000000000000001]: State change 1 --> 2
    I: 388119 [DIS]Resolving 5F72E24097313829:0000000000000001 ...
    I: 388127 [EM]>>> [E:34110r S:55573 M:214202346 (Ack:166002962)] (S) Msg RX from 1:000000000001B669 [3829] --- Type 0000:10 (SecureChannel:StandaloneAck)
    I: 388280 [DIS]Node ID resolved for 5F72E24097313829:0000000000000001
    D: 388286 [DIS] Hostname: E0D55EB9F3140000
    D: 388290 [DIS] IP Address #1: fd11:db8:1::1
    D: 388294 [DIS] Port: 5540
    D: 388296 [DIS] Mrp Interval idle: 300 ms
    D: 388300 [DIS] Mrp Interval active: 2000 ms
    D: 388304 [DIS] TCP Supported: 1
    D: 388307 [DIS]Lookup clearing interface for non LL address
    I: 388313 [DIS]UDP:[fd11:db8:1::1]:5540: new best score: 4
    I: 388318 [DIS]Checking node lookup status after 200 ms
    D: 388323 [DIS]OperationalSessionSetup[1:0000000000000001]: Updating device address to UDP:[fd11:db8:1::1]:5540 while in state 2
    D: 388334 [DIS]OperationalSessionSetup[1:0000000000000001]: State change 2 --> 3
    D: 388342 [IN]SecureSession[0x20003b18]: Allocated Type:2 LSID:55576
    I: 388348 [SC]Initiating session on local FabricIndex 1 from 0x0000000000000002 -> 0x0000000000000001
    I: 388503 [EM]<<< [E:34040i S:0 M:220107183] (U) Msg TX to 0:0000000000000000 [0000] --- Type 0000:30 (SecureChannel:CASE_Sigma1)
    I: 388514 [IN](U) Sending msg 220107183 to IP address 'UDP:[fd11:db8:1::1]:5540'
    I: 388523 [SC]Sent Sigma1 msg
    D: 388526 [DIS]OperationalSessionSetup[1:0000000000000001]: State change 3 --> 4
    E: 388534 [DL]Long dispatch time: 254 ms, for event type 2
    I: 389382 [IN](U) Sending msg 220107183 to IP address 'UDP:[fd11:db8:1::1]:5540'
    I: 390270 [IN](U) Sending msg 220107183 to IP address 'UDP:[fd11:db8:1::1]:5540'
    I: 391303 [IN](U) Sending msg 220107183 to IP address 'UDP:[fd11:db8:1::1]:5540'
    I: 392829 [IN](U) Sending msg 220107183 to IP address 'UDP:[fd11:db8:1::1]:5540'
    E: 394901 [EM]Failed to Send CHIP MessageCounter:220107183 on exchange 34040i sendCount: 4 max retries: 4
    E: 397226 [SC]CASESession timed out while waiting for a response from the peer. Current state was 1
    D: 397235 [IN]SecureSession[0x20003b18]: Released - Type:2 LSID:55576
    D: 397242 [DIS]OperationalSessionSetup[1:0000000000000001]: State change 4 --> 2
    D: 397249 [DIS]OperationalSessionSetup[1:0000000000000001]: State change 2 --> 1
    E: 397256 [SWU]Failed to connect to node 0x0000000000000001: 32
    I: 397263 [SWU]Unknown idle state reason so set the periodic timer for a next attempt
    I: 397271 [SWU]Stopping the watchdog timer
    I: 397275 [SWU]Starting the periodic query timer, timeout: 86400 seconds

    as you can see "I: 388523 [SC]Sent Sigma1 msg" Log is confirmed.


    I hope this information is helpful.Smile

    If you need additional information, please request it. 

Children
  • Hi,

    Just a heads up that I've queried the Matter team regarding the results you've posted and but I am yet to receive a result. The log from item 2 is still very helpful if you are able to get one! 

    I will be out of office until next week starting today, but I'll check back in with you and the status from the developers when I return.

    Kind regards,
    Andreas

  • Hi

    I'm back with some more info from the Matter team:

    It is hard to say what is going wrong. Everything looks quite correct regarding IP addresses and etc. The developers reproduced the test on their desk and pcap looks the same, with the one difference. For them the procedure works correctly and packets are forwarded. The next thing they suspect is that something must be wrong with the OpenThread Border Router or routing configuration, but since communication with CHIP Tool works correctly, this might not be the case

    1. Could you try to invoke the following two commands before running the OTBR docker and report back the result??
    sudo sysctl -w net.ipv6.conf.otbr0.accept_ra_rt_info_max_plen=128
    sudo sysctl -w net.ipv6.conf.otbr0.accept_ra=2

    2. If you've used a different OTBR setup than what is recommended/specified in the DFU guide & testing Matter in NCS guide, could you try with the recommended hardware and see if that makes any changes?

    Kind regards,
    Andreas

  • Thank you for your confirmation.


    The results of the confirmation of your request are as follows.

    1. After entering that command, I configured OTBR again and tested it, but the OTA did not proceed similarly. However, a different log has been identified.

    - Log to Matter Device

    I: 465451 [EM]>>> [E:34015r S:0 M:186092791] (U) Msg RX from 0:DBA51F5EF7A1A2AD [0000] --- Type 0000:30 (SecureChannel:CASE_Sigma1)
    I: 465463 [IN]CASE Server received Sigma1 message . Starting handshake. EC 0x20004e60
    I: 465471 [IN]CASE Server disabling CASE session setups
    I: 465476 [EM]<<< [E:34015r S:0 M:220419010 (Ack:186092791)] (U) Msg TX to 0:0000000000000000 [0000] --- Type 0000:10 (SecureChannel:StandaloneAck)
    I: 465489 [IN](U) Sending msg 220419010 to IP address 'UDP:[fd11:1111:1122:2222:3079:47c7:9eda:cb9a]:45258'
    I: 465500 [SC]Received Sigma1 msg
    I: 465507 [SC]CASE matched destination ID: fabricIndex 1, NodeID 0x0000000000000005
    I: 465723 [EM]<<< [E:34015r S:0 M:220419011 (Ack:186092791)] (U) Msg TX to 0:0000000000000000 [0000] --- Type 0000:31 (SecureChannel:CASE_Sigma2)
    I: 465735 [IN](U) Sending msg 220419011 to IP address 'UDP:[fd11:1111:1122:2222:3079:47c7:9eda:cb9a]:45258'
    I: 465747 [SC]Sent Sigma2 msg
    I: 465868 [EM]>>> [E:34015r S:0 M:186092792 (Ack:220419011)] (U) Msg RX from 0:DBA51F5EF7A1A2AD [0000] --- Type 0000:32 (SecureChannel:CASE_Sigma3)
    I: 465882 [EM]<<< [E:34015r S:0 M:220419012 (Ack:186092792)] (U) Msg TX to 0:0000000000000000 [0000] --- Type 0000:10 (SecureChannel:StandaloneAck)
    I: 465895 [IN](U) Sending msg 220419012 to IP address 'UDP:[fd11:1111:1122:2222:3079:47c7:9eda:cb9a]:45258'
    I: 465905 [SC]Received Sigma3 msg
    E: 465914 [SC]The device does not support GetClock_RealTimeMS() API: 3.  Falling back to Last Known Good UTC Time
    E: 466111 [DL]Long dispatch time: 187 ms, for event type 2
    I: 466214 [EM]<<< [E:34015r S:0 M:220419013 (Ack:186092792)] (U) Msg TX to 0:0000000000000000 [0000] --- Type 0000:40 (SecureChannel:StatusReport)
    I: 466227 [IN](U) Sending msg 220419013 to IP address 'UDP:[fd11:1111:1122:2222:3079:47c7:9eda:cb9a]:45258'
    I: 466239 [SC]SecureSession[0x20003838]: Moving from state 'kEstablishing' --> 'kActive'
    D: 466247 [IN]SecureSession[0x20003838]: Activated - Type:2 LSID:46171
    D: 466254 [IN]New secure session activated for device <000000000001B669, 1>, LSID:46171 PSID:48533!
    I: 466263 [IN]CASE Session established to peer: <000000000001B669, 1>
    I: 466270 [IN]CASE Server enabling CASE session setups
    D: 466277 [IN]SecureSession[0x200038f0]: Allocated Type:2 LSID:46173
    E: 466284 [DL]Long dispatch time: 168 ms, for event type 2
    I: 466291 [EM]>>> [E:34016r S:46171 M:85657165] (S) Msg RX from 1:000000000001B669 [E4A4] --- Type 0001:08 (IM:InvokeCommandRequest)
    I: 466303 [SWU]OTA Requestor received AnnounceOTAProvider
    D: 466308 [SWU]  FabricIndex: 1
    D: 466311 [SWU]  ProviderNodeID: 0x0000000000000001
    D: 466316 [SWU]  VendorID: 0x0
    D: 466319 [SWU]  AnnouncementReason: 0
    D: 466322 [SWU]  Endpoint: 0
    I: 466326 [EM]<<< [E:34016r S:46171 M:119443558 (Ack:85657165)] (S) Msg TX to 1:000000000001B669 [E4A4] --- Type 0001:09 (IM:InvokeCommandResponse)
    I: 466339 [IN](S) Sending msg 119443558 on secure session with LSID: 46171
    I: 466347 [EM]>>> [E:34015r S:0 M:186092793 (Ack:220419013)] (U) Msg RX from 0:DBA51F5EF7A1A2AD [0000] --- Type 0000:10 (SecureChannel:StandaloneAck)
    I: 466362 [SWU]Stopping the Periodic Query timer
    I: 466367 [SWU]Starting the watchdog timer, timeout: 21600 seconds
    D: 466373 [SWU]Establishing session to provider node ID 0x0000000000000001 on fabric index 1
    D: 466383 [DIS]OperationalSessionSetup[1:0000000000000001]: State change 1 --> 2
    I: 466390 [DIS]Resolving 8FAB4E5B9E78E4A4:0000000000000001 ...
    I: 466398 [EM]>>> [E:34016r S:46171 M:85657166 (Ack:119443558)] (S) Msg RX from 1:000000000001B669 [E4A4] --- Type 0000:10 (SecureChannel:StandaloneAck)
    I: 466451 [DIS]Node ID resolved for 8FAB4E5B9E78E4A4:0000000000000001
    D: 466457 [DIS] Hostname: E0D55EB9F3140000
    D: 466461 [DIS] IP Address #1: fd11:1111:1122:2222:3079:47c7:9eda:cb9a
    D: 466467 [DIS] Port: 5540
    D: 466470 [DIS] Mrp Interval idle: 300 ms
    D: 466474 [DIS] Mrp Interval active: 2000 ms
    D: 466478 [DIS] TCP Supported: 1
    D: 466481 [DIS]Lookup clearing interface for non LL address
    I: 466486 [DIS]UDP:[fd11:1111:1122:2222:3079:47c7:9eda:cb9a]:5540: new best score: 4
    I: 466493 [DIS]Checking node lookup status after 103 ms
    I: 466498 [DIS]Keeping DNSSD lookup active
    I: 466591 [DIS]Checking node lookup status after 200 ms
    D: 466596 [DIS]OperationalSessionSetup[1:0000000000000001]: Updating device address to UDP:[fd11:1111:1122:2222:3079:47c7:9eda:cb9a]:5540 while in state 2
    D: 466609 [DIS]OperationalSessionSetup[1:0000000000000001]: State change 2 --> 3
    D: 466617 [IN]SecureSession[0x200039a8]: Allocated Type:2 LSID:46174
    I: 466623 [SC]Initiating session on local FabricIndex 1 from 0x0000000000000005 -> 0x0000000000000001
    I: 466780 [EM]<<< [E:4672i S:0 M:220419014] (U) Msg TX to 0:0000000000000000 [0000] --- Type 0000:30 (SecureChannel:CASE_Sigma1)
    I: 466792 [IN](U) Sending msg 220419014 to IP address 'UDP:[fd11:1111:1122:2222:3079:47c7:9eda:cb9a]:5540'
    I: 466802 [SC]Sent Sigma1 msg
    D: 466805 [DIS]OperationalSessionSetup[1:0000000000000001]: State change 3 --> 4
    I: 467642 [IN](U) Sending msg 220419014 to IP address 'UDP:[fd11:1111:1122:2222:3079:47c7:9eda:cb9a]:5540'
    I: 468516 [IN](U) Sending msg 220419014 to IP address 'UDP:[fd11:1111:1122:2222:3079:47c7:9eda:cb9a]:5540'
    I: 469603 [IN](U) Sending msg 220419014 to IP address 'UDP:[fd11:1111:1122:2222:3079:47c7:9eda:cb9a]:5540'
    I: 470977 [IN](U) Sending msg 220419014 to IP address 'UDP:[fd11:1111:1122:2222:3079:47c7:9eda:cb9a]:5540'
    E: 472953 [EM]Failed to Send CHIP MessageCounter:220419014 on exchange 4672i sendCount: 4 max retries: 4
    E: 475504 [SC]CASESession timed out while waiting for a response from the peer. Current state was 1
    D: 475513 [IN]SecureSession[0x200039a8]: Released - Type:2 LSID:46174
    D: 475520 [DIS]OperationalSessionSetup[1:0000000000000001]: State change 4 --> 2
    D: 475527 [DIS]OperationalSessionSetup[1:0000000000000001]: State change 2 --> 1
    E: 475534 [SWU]Failed to connect to node 0x0000000000000001: 32
    I: 475541 [SWU]Unknown idle state reason so set the periodic timer for a next attempt
    I: 475549 [SWU]Stopping the watchdog timer
    I: 475553 [SWU]Starting the periodic query timer, timeout: 86400 seconds

    - Log to OTBR

    Jul  5 01:21:54 f6de2ba70eca otbr-agent[191]: 00:52:08.213 [I] MeshForwarder-: Sent IPv6 UDP msg, len:214, chksum:4ee2, ecn:no, to:0x6400, sec:yes, prio:low
    Jul  5 01:21:54 f6de2ba70eca otbr-agent[191]: 00:52:08.213 [I] MeshForwarder-:     src:[fd11:1111:1122:2222:3079:47c7:9eda:cb9a]:46501
    Jul  5 01:21:54 f6de2ba70eca otbr-agent[191]: 00:52:08.213 [I] MeshForwarder-:     dst:[fd11:22:0:0:33c1:f158:876a:7d0a]:5540
    Jul  5 01:21:54 f6de2ba70eca otbr-agent[191]: 00:52:08.270 [I] MeshForwarder-: Received IPv6 UDP msg, len:74, chksum:b837, ecn:no, from:0x6400, sec:yes, prio:normal, rss:-43.0
    Jul  5 01:21:54 f6de2ba70eca otbr-agent[191]: 00:52:08.270 [I] MeshForwarder-:     src:[fd11:22:0:0:33c1:f158:876a:7d0a]:5540
    Jul  5 01:21:54 f6de2ba70eca otbr-agent[191]: 00:52:08.270 [I] MeshForwarder-:     dst:[fd11:1111:1122:2222:3079:47c7:9eda:cb9a]:46501
    Jul  5 01:21:54 f6de2ba70eca otbr-agent[191]: 00:52:08.567 [I] MeshForwarder-: Received IPv6 UDP msg, len:780, chksum:763c, ecn:no, from:0x6400, sec:yes, prio:normal, rss:-40.0
    Jul  5 01:21:54 f6de2ba70eca otbr-agent[191]: 00:52:08.567 [I] MeshForwarder-:     src:[fd11:22:0:0:33c1:f158:876a:7d0a]:5540
    Jul  5 01:21:54 f6de2ba70eca otbr-agent[191]: 00:52:08.567 [I] MeshForwarder-:     dst:[fd11:1111:1122:2222:3079:47c7:9eda:cb9a]:46501
    Jul  5 01:21:54 f6de2ba70eca otbr-agent[191]: 00:52:08.626 [I] MeshForwarder-: Sent IPv6 UDP msg, len:646, chksum:e796, ecn:no, to:0x6400, sec:yes, prio:low
    Jul  5 01:21:54 f6de2ba70eca otbr-agent[191]: 00:52:08.626 [I] MeshForwarder-:     src:[fd11:1111:1122:2222:3079:47c7:9eda:cb9a]:46501
    Jul  5 01:21:54 f6de2ba70eca otbr-agent[191]: 00:52:08.627 [I] MeshForwarder-:     dst:[fd11:22:0:0:33c1:f158:876a:7d0a]:5540
    Jul  5 01:21:54 f6de2ba70eca otbr-agent[191]: 00:52:08.673 [I] MeshForwarder-: Received IPv6 UDP msg, len:74, chksum:b537, ecn:no, from:0x6400, sec:yes, prio:normal, rss:-41.0
    Jul  5 01:21:54 f6de2ba70eca otbr-agent[191]: 00:52:08.673 [I] MeshForwarder-:     src:[fd11:22:0:0:33c1:f158:876a:7d0a]:5540
    Jul  5 01:21:54 f6de2ba70eca otbr-agent[191]: 00:52:08.673 [I] MeshForwarder-:     dst:[fd11:1111:1122:2222:3079:47c7:9eda:cb9a]:46501
    Jul  5 01:21:55 f6de2ba70eca otbr-agent[191]: 00:52:09.008 [I] MeshForwarder-: Received IPv6 UDP msg, len:82, chksum:aff7, ecn:no, from:0x6400, sec:yes, prio:normal, rss:-41.0
    Jul  5 01:21:55 f6de2ba70eca otbr-agent[191]: 00:52:09.008 [I] MeshForwarder-:     src:[fd11:22:0:0:33c1:f158:876a:7d0a]:5540
    Jul  5 01:21:55 f6de2ba70eca otbr-agent[191]: 00:52:09.008 [I] MeshForwarder-:     dst:[fd11:1111:1122:2222:3079:47c7:9eda:cb9a]:46501
    Jul  5 01:21:55 f6de2ba70eca otbr-agent[191]: 00:52:09.025 [I] MeshForwarder-: Sent IPv6 UDP msg, len:119, chksum:a387, ecn:no, to:0x6400, sec:yes, prio:low
    Jul  5 01:21:55 f6de2ba70eca otbr-agent[191]: 00:52:09.025 [I] MeshForwarder-:     src:[fd11:1111:1122:2222:3079:47c7:9eda:cb9a]:46501
    Jul  5 01:21:55 f6de2ba70eca otbr-agent[191]: 00:52:09.025 [I] MeshForwarder-:     dst:[fd11:22:0:0:33c1:f158:876a:7d0a]:5540
    Jul  5 01:21:55 f6de2ba70eca otbr-agent[191]: 00:52:09.031 [I] MeshForwarder-: Sent IPv6 UDP msg, len:74, chksum:af37, ecn:no, to:0x6400, sec:yes, prio:low
    Jul  5 01:21:55 f6de2ba70eca otbr-agent[191]: 00:52:09.031 [I] MeshForwarder-:     src:[fd11:1111:1122:2222:3079:47c7:9eda:cb9a]:46501
    Jul  5 01:21:55 f6de2ba70eca otbr-agent[191]: 00:52:09.031 [I] MeshForwarder-:     dst:[fd11:22:0:0:33c1:f158:876a:7d0a]:5540
    Jul  5 01:21:55 f6de2ba70eca otbr-agent[191]: 00:52:09.124 [I] MeshForwarder-: Received IPv6 UDP msg, len:115, chksum:9ac8, ecn:no, from:0x6400, sec:yes, prio:normal, rss:-40.0
    Jul  5 01:21:55 f6de2ba70eca otbr-agent[191]: 00:52:09.124 [I] MeshForwarder-:     src:[fd11:22:0:0:33c1:f158:876a:7d0a]:5540
    Jul  5 01:21:55 f6de2ba70eca otbr-agent[191]: 00:52:09.124 [I] MeshForwarder-:     dst:[fd11:1111:1122:2222:3079:47c7:9eda:cb9a]:46501
    Jul  5 01:21:55 f6de2ba70eca otbr-agent[191]: 00:52:09.133 [I] MeshForwarder-: Sent IPv6 UDP msg, len:82, chksum:ab89, ecn:no, to:0x6400, sec:yes, prio:low
    Jul  5 01:21:55 f6de2ba70eca otbr-agent[191]: 00:52:09.133 [I] MeshForwarder-:     src:[fd11:1111:1122:2222:3079:47c7:9eda:cb9a]:46501
    Jul  5 01:21:55 f6de2ba70eca otbr-agent[191]: 00:52:09.133 [I] MeshForwarder-:     dst:[fd11:22:0:0:33c1:f158:876a:7d0a]:5540
    Jul  5 01:21:55 f6de2ba70eca otbr-agent[191]: 00:52:09.180 [I] MeshForwarder-: Received IPv6 UDP msg, len:206, chksum:88a0, ecn:no, from:0x6400, sec:yes, prio:normal, rss:-40.5
    Jul  5 01:21:55 f6de2ba70eca otbr-agent[191]: 00:52:09.180 [I] MeshForwarder-:     src:[fd4b:93b9:8e2f:21a9:e105:3c31:c9a6:c5fb]:49153
    Jul  5 01:21:55 f6de2ba70eca otbr-agent[191]: 00:52:09.180 [I] MeshForwarder-:     dst:[fd4b:93b9:8e2f:21a9:2cd6:7f27:11c9:efdf]:53
    Jul  5 01:21:55 f6de2ba70eca otbr-agent[191]: 00:52:09.180 [I] DnssdServer---: ANSWER: TRANSACTION=0x5f24, QUESTION=[8FAB4E5B9E78E4A4-0000000000000001._matter._tcp.default.service.arpa. 1 33], RCODE=3
    Jul  5 01:21:55 f6de2ba70eca otbr-agent[191]: 00:52:09.180 [I] DnssdServer---: ANSWER: TRANSACTION=0x5f24, QUESTION=[8FAB4E5B9E78E4A4-0000000000000001._matter._tcp.default.service.arpa. 1 16], RCODE=3
    Jul  5 01:21:55 f6de2ba70eca otbr-agent[191]: [INFO]-DPROXY--: Subscribe: 8FAB4E5B9E78E4A4-0000000000000001._matter._tcp.default.service.arpa.
    Jul  5 01:21:55 f6de2ba70eca otbr-agent[191]: [INFO]-MDNS----: Subscribe service 8FAB4E5B9E78E4A4-0000000000000001._matter._tcp (total 1)
    Jul  5 01:21:55 f6de2ba70eca otbr-agent[191]: [INFO]-MDNS----: DNSServiceResolve 8FAB4E5B9E78E4A4-0000000000000001 _matter._tcp inf 0
    Jul  5 01:21:55 f6de2ba70eca otbr-agent[191]: [INFO]-MDNS----: DNSServiceResolve reply: 8FAB4E5B9E78E4A4-0000000000000001._matter._tcp.local. host E0D55EB9F3140000.local.:42005, TXT=21B inf 6, flags=0
    Jul  5 01:21:55 f6de2ba70eca otbr-agent[191]: [INFO]-MDNS----: DNSServiceGetAddrInfo E0D55EB9F3140000.local. inf 6
    Jul  5 01:21:55 f6de2ba70eca otbr-agent[191]: [INFO]-MDNS----: DNSServiceGetAddrInfo reply: flags=1073741827, host=E0D55EB9F3140000.local., sa_family=10, error=0
    Jul  5 01:21:55 f6de2ba70eca otbr-agent[191]: [INFO]-MDNS----: DNSServiceGetAddrInfo reply: address=fd11:1111:1122:2222:3079:47c7:9eda:cb9a, ttl=120
    Jul  5 01:21:55 f6de2ba70eca otbr-agent[191]: [INFO]-MDNS----: Service _matter._tcp is resolved successfully: add 8FAB4E5B9E78E4A4-0000000000000001 host E0D55EB9F3140000.local. addresses 1
    Jul  5 01:21:55 f6de2ba70eca otbr-agent[191]: [INFO]-DPROXY--: Service discovered: _matter._tcp, instance 8FAB4E5B9E78E4A4-0000000000000001 hostname E0D55EB9F3140000.local. addresses 1 port 5540 priority 0 weight 0
    Jul  5 01:21:55 f6de2ba70eca otbr-agent[191]: [DEBG]-DPROXY--: Translate domain: E0D55EB9F3140000.local. => E0D55EB9F3140000.default.service.arpa.
    Jul  5 01:21:55 f6de2ba70eca otbr-agent[191]: [INFO]-DPROXY--: Unsubscribe: 8FAB4E5B9E78E4A4-0000000000000001._matter._tcp.default.service.arpa.
    Jul  5 01:21:55 f6de2ba70eca otbr-agent[191]: [INFO]-MDNS----: Unsubscribe service 8FAB4E5B9E78E4A4-0000000000000001._matter._tcp (left 0)
    Jul  5 01:21:55 f6de2ba70eca otbr-agent[191]: 00:52:09.181 [I] DnssdServer---: send DNS-SD reply: OK, RCODE=0
    Jul  5 01:21:55 f6de2ba70eca otbr-agent[191]: 00:52:09.205 [I] MeshForwarder-: Sent IPv6 UDP msg, len:257, chksum:4f65, ecn:no, to:0x6400, sec:yes, prio:normal
    Jul  5 01:21:55 f6de2ba70eca otbr-agent[191]: 00:52:09.205 [I] MeshForwarder-:     src:[fd4b:93b9:8e2f:21a9:2cd6:7f27:11c9:efdf]:53
    Jul  5 01:21:55 f6de2ba70eca otbr-agent[191]: 00:52:09.205 [I] MeshForwarder-:     dst:[fd4b:93b9:8e2f:21a9:e105:3c31:c9a6:c5fb]:49153
    Jul  5 01:21:55 f6de2ba70eca otbr-agent[191]: 00:52:09.583 [I] MeshForwarder-: Received IPv6 UDP msg, len:225, chksum:8bd1, ecn:no, from:0x6400, sec:yes, prio:normal, rss:-40.0
    Jul  5 01:21:55 f6de2ba70eca otbr-agent[191]: 00:52:09.583 [I] MeshForwarder-:     src:[fd11:22:0:0:33c1:f158:876a:7d0a]:5540
    Jul  5 01:21:55 f6de2ba70eca otbr-agent[191]: 00:52:09.583 [I] MeshForwarder-:     dst:[fd11:1111:1122:2222:3079:47c7:9eda:cb9a]:5540
    Jul  5 01:21:56 f6de2ba70eca otbr-agent[191]: 00:52:10.473 [I] MeshForwarder-: Received IPv6 UDP msg, len:225, chksum:8bd1, ecn:no, from:0x6400, sec:yes, prio:normal, rss:-41.25
    Jul  5 01:21:56 f6de2ba70eca otbr-agent[191]: 00:52:10.473 [I] MeshForwarder-:     src:[fd11:22:0:0:33c1:f158:876a:7d0a]:5540
    Jul  5 01:21:56 f6de2ba70eca otbr-agent[191]: 00:52:10.473 [I] MeshForwarder-:     dst:[fd11:1111:1122:2222:3079:47c7:9eda:cb9a]:5540
    Jul  5 01:21:57 f6de2ba70eca otbr-agent[191]: 00:52:11.339 [I] MeshForwarder-: Received IPv6 UDP msg, len:225, chksum:8bd1, ecn:no, from:0x6400, sec:yes, prio:normal, rss:-41.0
    Jul  5 01:21:57 f6de2ba70eca otbr-agent[191]: 00:52:11.340 [I] MeshForwarder-:     src:[fd11:22:0:0:33c1:f158:876a:7d0a]:5540
    Jul  5 01:21:57 f6de2ba70eca otbr-agent[191]: 00:52:11.340 [I] MeshForwarder-:     dst:[fd11:1111:1122:2222:3079:47c7:9eda:cb9a]:5540
    Jul  5 01:21:58 f6de2ba70eca otbr-agent[191]: 00:52:12.464 [I] MeshForwarder-: Received IPv6 UDP msg, len:225, chksum:8bd1, ecn:no, from:0x6400, sec:yes, prio:normal, rss:-41.0
    Jul  5 01:21:58 f6de2ba70eca otbr-agent[191]: 00:52:12.464 [I] MeshForwarder-:     src:[fd11:22:0:0:33c1:f158:876a:7d0a]:5540
    Jul  5 01:21:58 f6de2ba70eca otbr-agent[191]: 00:52:12.464 [I] MeshForwarder-:     dst:[fd11:1111:1122:2222:3079:47c7:9eda:cb9a]:5540
    Jul  5 01:22:00 f6de2ba70eca otbr-agent[191]: 00:52:13.958 [I] MeshForwarder-: Received IPv6 UDP msg, len:225, chksum:8bd1, ecn:no, from:0x6400, sec:yes, prio:normal, rss:-41.0
    Jul  5 01:22:00 f6de2ba70eca otbr-agent[191]: 00:52:13.958 [I] MeshForwarder-:     src:[fd11:22:0:0:33c1:f158:876a:7d0a]:5540
    Jul  5 01:22:00 f6de2ba70eca otbr-agent[191]: 00:52:13.958 [I] MeshForwarder-:     dst:[fd11:1111:1122:2222:3079:47c7:9eda:cb9a]:5540
    Jul  5 01:22:09 f6de2ba70eca otbr-agent[191]: 00:52:22.967 [I] Mle-----------: Send Advertisement (ff02:0:0:0:0:0:0:1)
    Jul  5 01:22:09 f6de2ba70eca otbr-agent[191]: 00:52:22.971 [I] MeshForwarder-: Sent IPv6 UDP msg, len:91, chksum:872d, ecn:no, to:0xffff, sec:no, prio:net
    Jul  5 01:22:09 f6de2ba70eca otbr-agent[191]: 00:52:22.971 [I] MeshForwarder-:     src:[fe80:0:0:0:c11:c613:ac00:ab74]:19788
    Jul  5 01:22:09 f6de2ba70eca otbr-agent[191]: 00:52:22.971 [I] MeshForwarder-:     dst:[ff02:0:0:0:0:0:0:1]:19788
    Jul  5 01:22:13 f6de2ba70eca otbr-agent[191]: 00:52:27.630 [I] MeshForwarder-: Received IPv6 UDP msg, len:91, chksum:5158, ecn:no, from:46f1453276713147, sec:no, prio:net, rss:-40.0
    Jul  5 01:22:13 f6de2ba70eca otbr-agent[191]: 00:52:27.630 [I] MeshForwarder-:     src:[fe80:0:0:0:44f1:4532:7671:3147]:19788
    Jul  5 01:22:13 f6de2ba70eca otbr-agent[191]: 00:52:27.630 [I] MeshForwarder-:     dst:[ff02:0:0:0:0:0:0:1]:19788
    Jul  5 01:22:13 f6de2ba70eca otbr-agent[191]: 00:52:27.630 [I] Mle-----------: Receive Advertisement (fe80:0:0:0:44f1:4532:7671:3147,0x6400)

    - Wire Shark capture

    Cp3.pcapng

    Unlike before, OTBR also showed a response during the announce-otaprovider.

    2. Yes, I configured it the same as the site guide. But could you check if the environment we organized is correct? The configuration is as follows.
    (Please let me know if you need additional confirmation of our configuration environment)


    - OTBR Form Therd Networks

    Lastly, can I get the OTA file (Build Target: nrf52840DK) that the Matter team used?
    I'd like to replace the OTA file we used for the test.

    Thank you..Smile

  • Hi, 

    Starting with the "simplest" first: 

    bluemelony said:
    2. Yes, I configured it the same as the site guide. But could you check if the environment we organized is correct? The configuration is as follows.
    (Please let me know if you need additional confirmation of our configuration environment)

    The topology looks correct. The CHIP tool is missing in the picture, but we assume that it is running on the Ubuntu PC on the left (you've mentioned this at some point).

    bluemelony said:
    Lastly, can I get the OTA file (Build Target: nrf52840DK) that the Matter team used?
    I'd like to replace the OTA file we used for the test.

    Here's the files

    Matter_OTA_files.zip

    bluemelony said:
    1. After entering that command, I configured OTBR again and tested it, but the OTA did not proceed similarly. However, a different log has been identified.

    Once again it looks like everything should be fine with your setup, but the logs looks similar. The CASE Sigma1 message is not forwarded by the OTBR to the OTA Provider so we strongly believe that it is caused by a routing issue related to the used IP addresses, but what is strange is that a couple of messages before this should occur, the OTBR is able to forward messages to the CHIP Tool running on the same PC and using the same IP addresses. The Matter devs will be looking into this, but for now this is unfortunately where we're stuck

    I will let you know if they conclude on anything, but do note that we're entering the main summer vacation period here in Norway so response time will be slower from now on and out

    I apologize for the inconvenience that may cause, and I hope we're able to resolve the issue in spite of the longer response time

    Kind regards,
    Andreas

Related