Bus fault from spi_write_dt

I'm getting a bus fault from the following code when it hits spi_write_dt:

    printk("Getting spi0\n");
	spi_dev = DEVICE_DT_GET(DT_NODELABEL(spi0));

    if( spi_dev == NULL ) {
        printk("SPI not initialized.\n");
        return SPI_NOT_INITIALIZED;
    } else if( ! device_is_ready(spi_dev) ) {
        printk("SPI not ready.\n");
        return SPI_NOT_READY;
    }
    uint8_t spi_bytes[2] = {0};
    struct spi_buf my_spi_buf[1]; // Buffer to hold one set of SPI data
    my_spi_buf[0].buf = spi_bytes; // The byte array to send
    my_spi_buf[0].len = 2; // Number of bytes in buffer
    struct spi_buf_set tx_buff;
    tx_buff.buffers = my_spi_buf;
    tx_buff.count = 1;

    return spi_write_dt(spi_dev,&tx_buff);
    

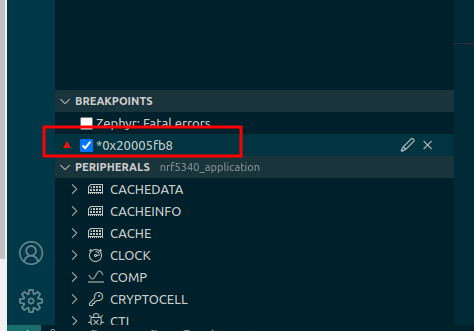
Here's the fault as reported to the UART:

Getting spi0
[00:00:23.264,434] <err> os: bus_fault: ***** BUS FAULT *****
[00:00:23.264,434] <err> os: bus_fault:   Precise data bus error
[00:00:23.264,465] <err> os: bus_fault:   BFAR Address: 0x30303033
[00:00:23.264,465] <err> os: esf_dump: r0/a1:  0x000328ea  r1/a2:  0x0002e00c  r2/a3:  0x30303033
[00:00:23.264,495] <err> os: esf_dump: r3/a4:  0x00000000 r12/ip:  0x0000000c r14/lr:  0x00011a9f
[00:00:23.264,495] <err> os: esf_dump:  xpsr:  0x01000000
[00:00:23.264,526] <err> os: esf_dump: Faulting instruction address (r15/pc): 0x00011ac8
[00:00:23.264,556] <err> os: z_fatal_error: >>> ZEPHYR FATAL ERROR 0: CPU exception on CPU 0
[00:00:23.264,587] <err> os: z_fatal_error: Current thread: 0x20002088 (unknown)
[00:00:23.368,530] <err> fatal_error: k_sys_fatal_error_handler: Resetting system
*** Booting Zephyr OS build v3.2.99-ncs2 ***
etc...

My overlay file sets the status to okay and sets a GPIO as a chip select:

&spi0 {
    cs-gpios = <&gpio0 18 GPIO_ACTIVE_LOW>;
    status = "okay";
};

My module is the Laird BL652 which gives me a dts file with this in it:

&spi0 {
	compatible = "nordic,nrf-spi";
	/* Cannot be used together with i2c0. */
	/* status = "okay"; */
	cs-gpios = <&gpio0 22 GPIO_ACTIVE_LOW>;
	pinctrl-0 = <&spi0_default>;
	pinctrl-1 = <&spi0_sleep>;
	pinctrl-names = "default", "sleep";
};

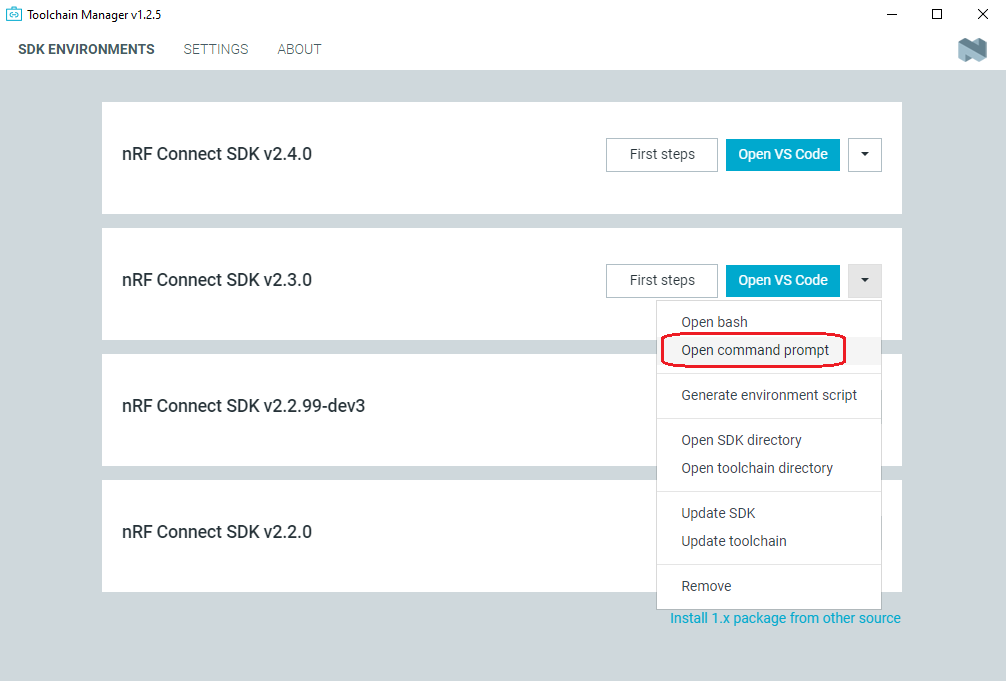
My dev environment version is 2.30.

Any idea why I might be getting the bus fault?

  • Hello,

    I don't see any immediate issues with the code or configurations you posted. It would be helpful to know where the bus fault was raised. You can use the 'addr2line' from the command line to look up the 'Faulting instruction address'.

    e.g.

    /* zephyr.elf is found in <build folder>/zephyr */
    $ ncs/toolchains/v2.3.0/opt/zephyr-sdk/arm-zephyr-eabi/bin/arm-zephyr-eabi-addr2line -e zephyr.elf 0x00011ac8
    

    Best regards,

    Vidar

  • I think I found my problem. Here's the prototype for spi_write_dt:

    static inline int spi_write_dt(const struct spi_dt_spec *spec,
    			       const struct spi_buf_set *tx_bufs)

    Note that it takes a pointer to a spi_dt_spec structure, not a device. Inside that struct are a pointer to a device and also a spi_config struct which apparently is only used when the device is a SPI slave.

    Another wrinkle is that the argument to spi_write_dt has to be of type const, which makes it hard to initialize the .bus field in the spi_dt_spec struct. Here's a trick to do it at declaration time:

        const struct spi_buf my_spi_buf[1] = {// Buffer to hold one set of SPI data
            [0].buf = spi_bytes,// The byte array to send
            [0].len = 2// Number of bytes in buffer
        };
        const struct spi_buf_set tx_buff = {
            .buffers = my_spi_buf,
            .count = 1
        };
        

  • 'addr2line' is a command-line tool that converts input addresses to file names and line numbers. It is included as part of the toolchain. To run it, open the command prompt via the toolchain manager and type 'arm-zephyr-eabi-addr2line -e <your application>.elf <address input>.

    Another approach is to set a breakpoint at the faulting address in your debugger and see where your program halts when the breakpoint is reached.

    Here's how you can set a breakpoint at an arbitrary address in VS Code


    Debugging of busfaults is not covered by the SDK documentation.

Related