Nrf connect SDK: Debugging not working for VS Code

Hi,

I am developing using latest version of nrf connect SDK (v2.4.0) and latest nrf command line tool and jlink software on Windows 11 (64-bit latest version). The code builds and flashes fine. When I try to run debug session, it fails with following error:
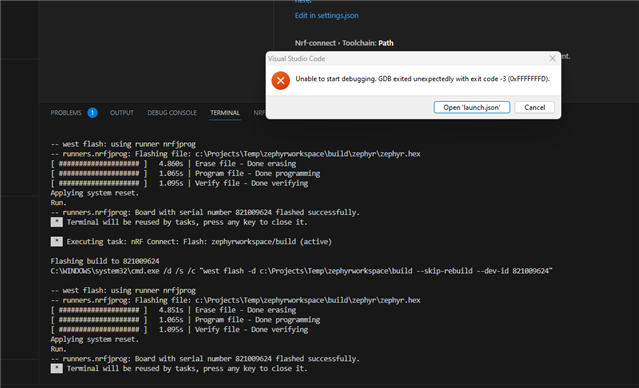
If I uninstall and re-install everything, it runs OK and I can start debug session on first launch. From second time onwards, it always fails with this error. I completely removed nrf connect sdk, vs code including their workspace and setting folders.

Additional remark: With earlier version of tools (ncs 2.3, and older version of toolchain manger), I was able to select cortex-debug instead of nrf-debug as debugging option. And that worked without any issues. Recently, i am unable to find this setting in the vs code extension settings. Now only default debugger nrf-debug is there which is not work as described above.

Where can i start looking and how can we get back the option to select cortex-debug ?

Thanks for the support

  • Hi,

    Could you please specify the versions of:
    - NCS
    - nRF Connect for Desktop
    - Toolchain Manager
    - nRF Command Line Tools
    - jLink
    - VS Code extension
    which you used in both working and non-working case?

    Best regards,
    Dejan

  • Hi,

    Below is the version information


    - NCS -> V2.4.0 (C:\ncs\toolchains\31f4403e35)

    - nRF Connect for Desktop -> v4.1.2 
    - Toolchain Manager -> v1.2.5
    - nRF Command Line Tools -> 10.22.1 
    - jLink -> 7.88l
    - VS Code extension -> v2023.6.345

    We found a workaround to get cortex-debug working by creating a launch.json with following configuration:

            {
                "name": "Cortex Debug Windows",
                "type": "cortex-debug",
                "request": "launch",
                "executable": "${workspaceFolder}/build/zephyr/zephyr.elf",
                "cwd": "${workspaceFolder}",
                "servertype": "jlink",
                "device":"nRF52840_xxAA",
                "interface": "swd",
                "gdbPath": "C:/ncs/toolchains/31f4403e35/opt/zephyr-sdk/arm-zephyr-eabi/bin/arm-zephyr-eabi-gdb.exe",
                "serverpath": "C:/Program Files/SEGGER/JLink/JLinkGDBServerCL.exe",
                "runToEntryPoint": "main",
                "rtos": "C:/Program Files/SEGGER/JLink/GDBServer/RTOSPlugin_Zephyr.dll",
                "serverArgs": [
                    "-speed",
                    "4000"
                ]
            }      
    And used "Bind to Launch Configuration" from 'Debug' command option. And with this debugger seems to start. I could not yet get 'nrf-connect' debug type working (if it has some advantages over cortex-debug)
    Regards,
    Amir
  • Hi Amir,

    Thank you for providing the workaround. To get more information with the type of errors which you showed, more logs in the debug output can be included by enabling fields in the logging object in your launch configuration. There is a way to customize launch and debug configurations as shown in how to use custom launch and debug configurations.

    Best regards,
    Dejan


  • Hi Dejan,

    Apparently, the default nrf-connect debug configuration was using 12000khz SWD speed (discovered with the logging) which my Jlink base compact wound not support. So I modified the setting to 4000khz and debugging is working fine.

            {

                "type": "nrf-connect",
                "request": "launch",
                "name": "Launch active build configuration",
                "config": "${activeConfig}",
                "runToEntryPoint": "main",
                "serverArgs": "-if swd -device ${device} -speed 4000 -port ${port} -singlerun -nogui -halt -noir -silent -rtos ${rtosPlugin}"          
            }
  • Hi Amir,

    Thank you for providing your solution.

    I am glad to hear that debugging is working well.

    Best regards,
    Dejan

Related