
It is an extension of the ticket below.
devzone.nordicsemi.com/.../nrf5340-current-consumption-issues
I'd like to find out what causes the huge difference in current consumption on the two boards.
An online power profiler (OPP) was used to estimate the radio current, and PPK2 was used to measure the actual current consumption of the board.
<52832>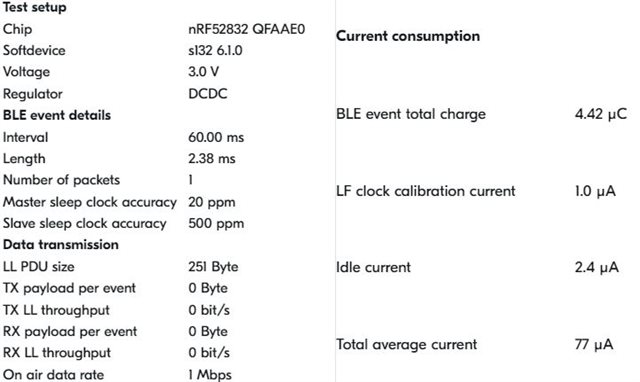
OPP: 77uA
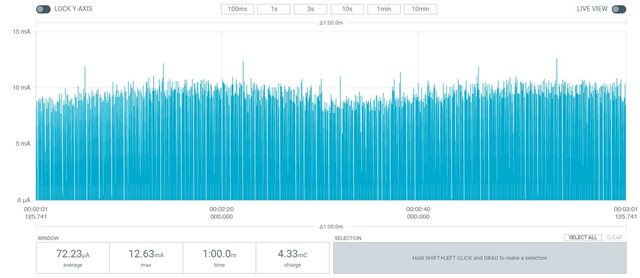
Measurements: 72.23 uA
Measurement_base: 3.04 uA
<5340>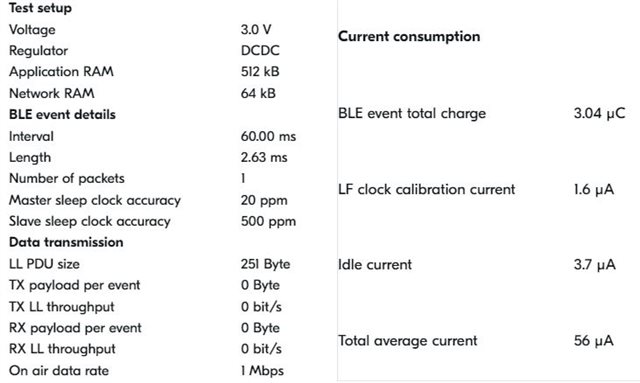
OPP: 56uA
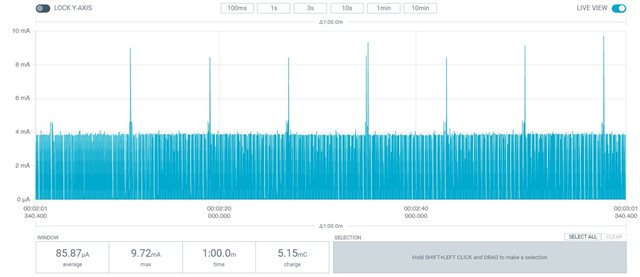
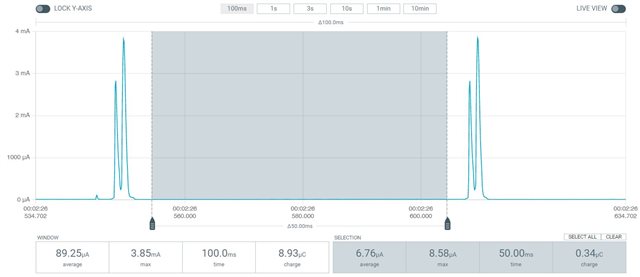
Measurements: 85.87 uA
Measurement_base: 6.76 uA
OPP simulations suggest that the 5340 will have lower current consumption, but measurements do not.
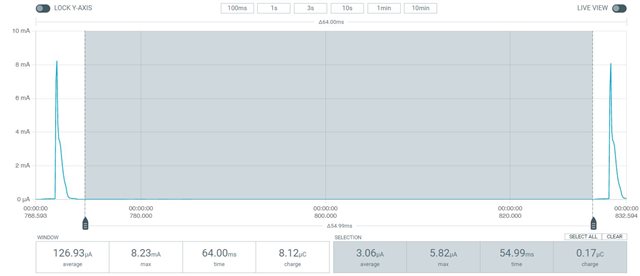
Comparing the currents over one connection interval clearly shows the difference. Both radio/idle the 5340 has high current consumption.
<52832>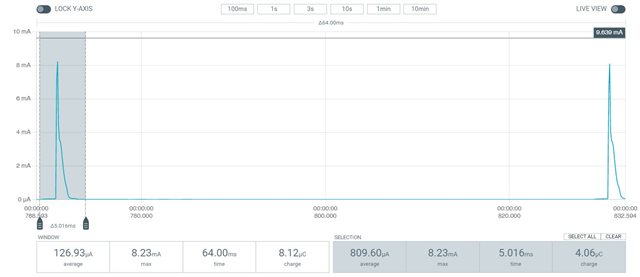
Interval (60 ms): 70.28 uA
Peak (5 ms): 809.6 uA
Base (55 ms): 3.06 uA
<5340>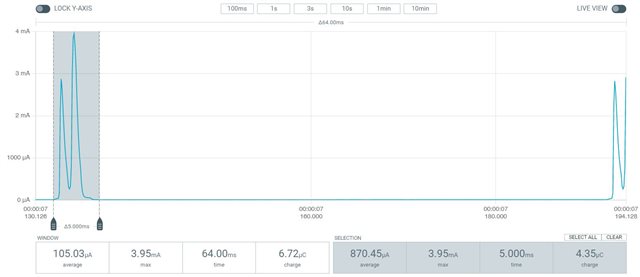
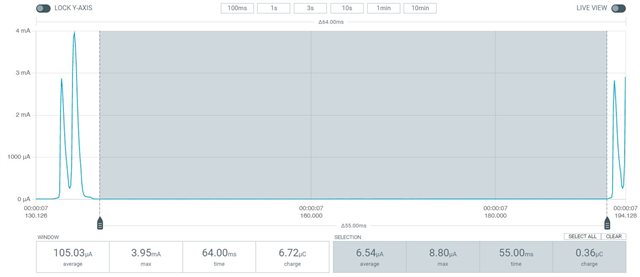
Interval: 78.53 uA
Peak: 870.45 uA
Base: 6.54 uA
I'd like to know where this difference comes from.
Is it simply because the 5340 has two cores?
52832, IDDFLASHCACHEDCDC: 3.7 mA
5340, IAPPCPU3 + INETCPU2: 3.6 mA + 2.6 mA = 6.2 mA
I tried to compare the current consumption of the two mcu peripherals in the datasheet, but the 5340 doesn't provide enough information. (gpiote, pof...)
I want to make sure I've achieved sufficient current optimization.

