Possible SIGTRAP in Softdevice S140

Hello,

We are currently in the progress of porting a project from the nrf52840dk reference board to a custom board and are having some issues during initilization.

Setup is using Softdevice S140 7.2.0 and nRF52 SDK 17.1.0 using secure_bootloader

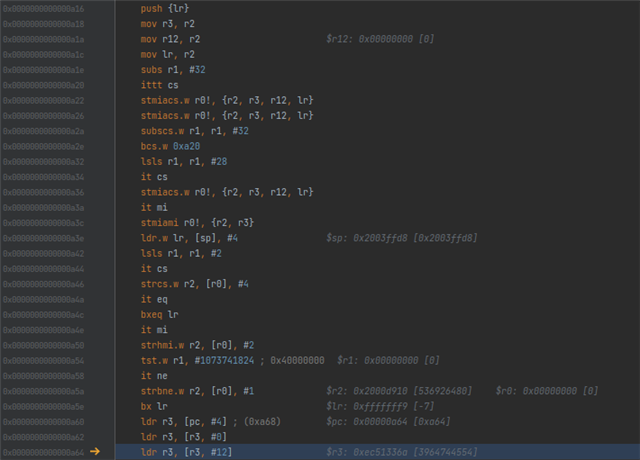
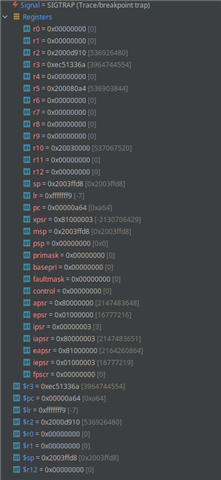
On the nrf52840dk we can flash and get RTT logs without issue but when flashing to the custom board we get a SIGTRAP before the bootloader main() that seems to be located in the softdevice.

Any advice or hints where to continue digging?

Parents
  • Hi,

    What is the differences in the firmware you run on the DK (successfully) and the firmware you run on your custom board?

  • Hi,

    bsp_board_init() has been changed to not use any led's or buttons as there are other devices connected, ie a empty function compared with components/boards/boards.c.

    NRF_DFU_HW_VERSION has been changed.

    New signing key for application image as been included.

    Aligned ld linker-scripts to keep the rtt sections at the same place between both bootloader and application. We are using SEGGER_RTT_SECTION set to ".rtt" and then defining a

    .rtt (NOLOAD) :
    {
    } > RAM

    in the linker-script.

    Of course using a external segger jlink on the custom board instead of the embedded jlink on the DK board. JMemExe, JLinkGDBServer and JLinkRTTViewerExe works as expected from what i can see.

    During troubleshooting i did changed the linker-script to allocate a bit more ram for the SD.

    RAM (rwx) :  ORIGIN = 0x20008000, LENGTH = 0x38000

    Do you have a mail i could share the linker-scripts on?

  • Hi,

    I see. None of that should explain why you see a difference in the buffer handling in the logger, though. How did you narrow down to the values of the pointers in nrf_memobj_alloc()? Could it be that you are missing something when debugging? First of all, I would suggest disablign optimization when debugging you have not done so. And as you wrote earlier that you had some problems with GDB (I know I do), perhaps it would be better to use a GUI debugger, like Segger Ozone? (note that you. need to change the Ozon configuration to start from address 0 as described in this post, or just attach to the running target if the issue does not occur immediately).

    patric said:
    Do you have a mail i could share the linker-scripts on?

    You can upload here (Insert -> Image/video/file) or make a new private case where you refer to this thread, and upload there if you do not want tos hare it publically.

Reply
  • Hi,

    I see. None of that should explain why you see a difference in the buffer handling in the logger, though. How did you narrow down to the values of the pointers in nrf_memobj_alloc()? Could it be that you are missing something when debugging? First of all, I would suggest disablign optimization when debugging you have not done so. And as you wrote earlier that you had some problems with GDB (I know I do), perhaps it would be better to use a GUI debugger, like Segger Ozone? (note that you. need to change the Ozon configuration to start from address 0 as described in this post, or just attach to the running target if the issue does not occur immediately).

    patric said:
    Do you have a mail i could share the linker-scripts on?

    You can upload here (Insert -> Image/video/file) or make a new private case where you refer to this thread, and upload there if you do not want tos hare it publically.

Children
Related