Hi,
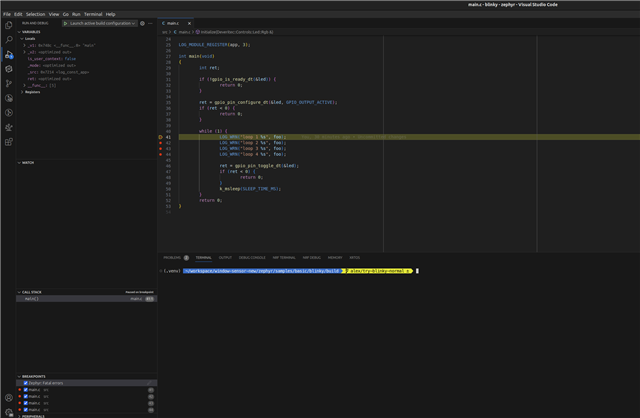
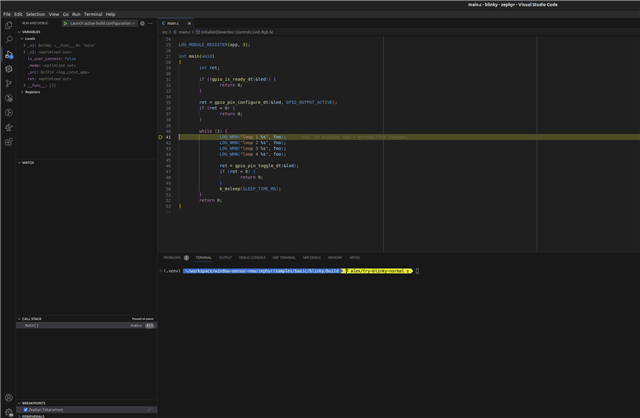
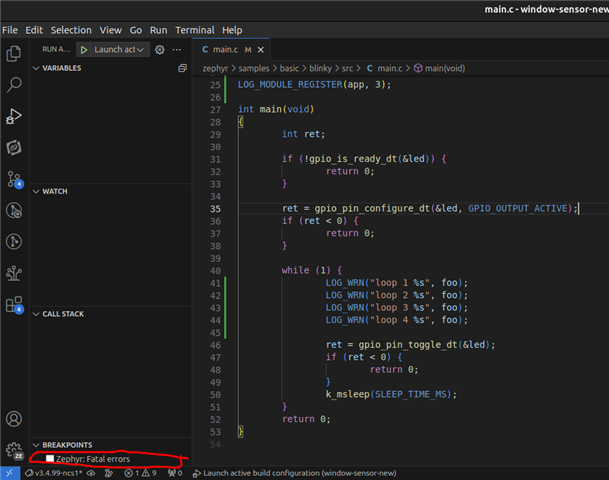
as mentioned in the title, when using the official vscode extension (nRF Connect for VS Code) for debugging and stopping a debug session, the target state does not get restored. Apparently the debugging interface is just left powered on even after the debug session is stopped, which leads to a high power consumption. That's actually the reason why I discovered this (at the time of writing this, not yet confirmed) bug.
Background on the power consumption observation: I have a stripped down board here with essentially nothing but a nrf52840 on it. I'm running a zephyr based firmware on it to get it to consume as little current as possible at 3V. The firmware just does a `k_sleep(K_FOREVER);`, that's it. All peripherals should be disabled. I get a current draw of about 5,2 uA (measured with KEITHLEY and ROHDE&SCHWARTZ power supply) that way. With the debugger connected the current draw is around 30 uA. So Far everything is normal and as expected.
When I start a debug session via the vscode plugin, of course the current consumption goes significantly up, to 1.5 mA. After stopping the debugging session the (button with red square in vscode), the current consumption rises a bit more to 1.6 mA and stays there. I found this post: Resetting DIF to reduce interface current on nRF52
It explains how to turn off the debugging interface with commands via JLinkExe:
```
SWDSelect
SWDWriteDP 1 0x04000000
exit
```

After doing this, I'm back to the expected 30 uA as before. Therefore I think that the extension is just not resetting the target state.

In contrast here is what happens with Cortex-Debug extension for vscode (https://marketplace.visualstudio.com/items?itemName=marus25.cortex-debug) in the gdb-server terminal that pops up:

```
GDB closed TCP/IP connection (Socket 13)
Restoring target state and closing J-Link connection...
Shutting down..
```
and the current consumption goes back to 30 uA as expected.
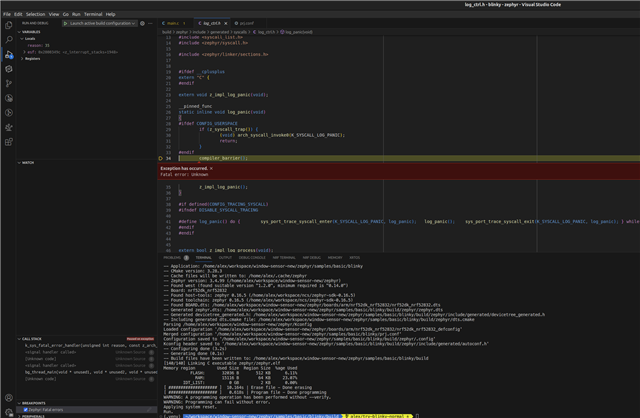
With the nrf-connect extension when stopping the debugging session I only see in the debug console:
```
Kill the program being debugged? (y or n) [answered Y; input not from terminal]
[Inferior 1 (Remote target) killed]
JLinkGDBServerCLExe: GDB closed TCP/IP connection (Socket 12)
The program '/home/alex/workspace/window-sensor-new/firmware/application_firmware/sample/button-led/build_maco_contact_type1/zephyr/zephyr.elf' has exited with code 0 (0x00000000).
```
But no trace of "Restoring target state and closing J-Link connection...".
After investigating a bit more, it seems to me that the cortex-debug extension simply uses the JLinkGDBServerCLExe underneath. If I manually do:
`nrfjprog --reset && JLinkGDBServerCLExe -if swd -device NRF52840_xxaa -speed 4000 -nogui -nohalt -noir`
I see the same current draw increase to 1.5 mA. After closing the gdb server (ctrl+c) I see:
```
Waiting for GDB connection...^CRestoring target state and closing J-Link connection...
Shutting down...
```
So the target state seems to be restored here as well.
What does the nRF Connect for VS Code do differently? Does it not use `JLinkGDBServerCLExe` underneath? Does it stop/kill it differently so that it does not do the "Restoring target state and closing J-Link connection..."? Is this a bug?