[nRF Connect for VS Code][BUG?] Debugging in vscode does not restore target state when stopping a debug session

Hi,

as mentioned in the title, when using the official vscode extension (nRF Connect for VS Code) for debugging and stopping a debug session, the target state does not get restored. Apparently the debugging interface is just left powered on even after the debug session is stopped, which leads to a high power consumption. That's actually the reason why I discovered this (at the time of writing this, not yet confirmed) bug.

Background on the power consumption observation: I have a stripped down board here with essentially nothing but a nrf52840 on it. I'm running a zephyr based firmware on it to get it to consume as little current as possible at 3V. The firmware just does a `k_sleep(K_FOREVER);`, that's it. All peripherals should be disabled. I get a current draw of about 5,2 uA (measured with KEITHLEY and ROHDE&SCHWARTZ power supply) that way. With the debugger connected the current draw is around 30 uA. So Far everything is normal and as expected.

When I start a debug session via the vscode plugin, of course the current consumption goes significantly up, to 1.5 mA. After stopping the debugging session the (button with red square in vscode), the current consumption rises a bit more to 1.6 mA and stays there. I found this post:  Resetting DIF to reduce interface current on nRF52 

It explains how to turn off the debugging interface with commands via JLinkExe:


```
SWDSelect
SWDWriteDP 1 0x04000000
exit
```

After doing this, I'm back to the expected 30 uA as before. Therefore I think that the extension is just not resetting the target state.

In contrast here is what happens with Cortex-Debug extension for vscode (https://marketplace.visualstudio.com/items?itemName=marus25.cortex-debug) in the gdb-server terminal that pops up:

```
GDB closed TCP/IP connection (Socket 13)
Restoring target state and closing J-Link connection...
Shutting down..
```

and the current consumption goes back to 30 uA as expected.


With the nrf-connect extension when stopping the debugging session I only see in the debug console:

```

Kill the program being debugged? (y or n) [answered Y; input not from terminal]
[Inferior 1 (Remote target) killed]
JLinkGDBServerCLExe: GDB closed TCP/IP connection (Socket 12)
The program '/home/alex/workspace/window-sensor-new/firmware/application_firmware/sample/button-led/build_maco_contact_type1/zephyr/zephyr.elf' has exited with code 0 (0x00000000).

```

But no trace of "Restoring target state and closing J-Link connection...".

After investigating a bit more, it seems to me that the cortex-debug extension simply uses the JLinkGDBServerCLExe underneath. If I manually do:

`nrfjprog --reset &&  JLinkGDBServerCLExe -if swd -device NRF52840_xxaa -speed 4000 -nogui -nohalt -noir`


I see the same current draw increase to 1.5 mA. After closing the gdb server (ctrl+c) I see:

```

Waiting for GDB connection...^CRestoring target state and closing J-Link connection...
Shutting down...

```

So the target state seems to be restored here as well. 

What does the nRF Connect for VS Code do differently? Does it not use `JLinkGDBServerCLExe` underneath? Does it stop/kill it differently so that it does not do the "Restoring target state and closing J-Link connection..."? Is this a bug?

Parents
  • lx_brz said:

    With regard to turning off the debug interface, this is correct, but not with regard to breakpoints. As mentioned, the breakpoints remain active even after stopping the debug session. When you power cycle the board and have no debugger attached, the device will hit the breakpoints that the extension did not remove on disconnect and will run into a hard fault.

    Well that is strange. I see now that you mentioned this in your previous response as well, I didn't notice that before.

    Are you seeing this with a DK as well? I just tried it here, with a few breakpoints on a Blinky sample, and restarting it seemed to do the trick. I didn't think the debugger actually patched the flash itself. How are you testing this on your side?

    lx_brz said:
    No worries, all good, that's why I'm here to annoy you guys with my questions Slight smile

    Hehe sounds good Thumbsup Keep them coming!

    Regards,

    Elfving

  • Are you seeing this with a DK as well?

    I took me some time, but I was able to create a minimal working example that shows the same problem with the nrf52DK board and a slightly modified blinky application. With the following setup the problem is reproducible 100% of the time on my side. It was a bit tricky to find a configuration that shows this though, a lot of trial and error.

    Modified code:

    /*
     * Copyright (c) 2016 Intel Corporation
     *
     * SPDX-License-Identifier: Apache-2.0
     */
    
    #include <zephyr/kernel.h>
    #include <zephyr/logging/log.h>
    #include <zephyr/drivers/gpio.h>
    
    /* 1000 msec = 1 sec */
    #define SLEEP_TIME_MS 1000
    
    /* The devicetree node identifier for the "led0" alias. */
    #define LED0_NODE DT_ALIAS(led0)
    
    /*
     * A build error on this line means your board is unsupported.
     * See the sample documentation for information on how to fix this.
     */
    static const struct gpio_dt_spec led = GPIO_DT_SPEC_GET(LED0_NODE, gpios);
    
    const char *foo = "foo";
    
    LOG_MODULE_REGISTER(app, 3);
    
    int main(void)
    {
    	int ret;
    
    	if (!gpio_is_ready_dt(&led)) {
    		return 0;
    	}
    
    	ret = gpio_pin_configure_dt(&led, GPIO_OUTPUT_ACTIVE);
    	if (ret < 0) {
    		return 0;
    	}
    
    	while (1) {
    		LOG_WRN("loop 1 %s", foo);
    		LOG_WRN("loop 2 %s", foo);
    		LOG_WRN("loop 3 %s", foo);
    		LOG_WRN("loop 4 %s", foo);
    
    		ret = gpio_pin_toggle_dt(&led);
    		if (ret < 0) {
    			return 0;
    		}
    		k_msleep(SLEEP_TIME_MS);
    	}
    	return 0;
    }

    modified prj.conf (this is important, even minor changes to the conf change the behavior):

    CONFIG_GPIO=y
    
    CONFIG_LOG=y
    
    CONFIG_CBPRINTF_NANO=y
    
    CONFIG_LOG_FUNC_NAME_PREFIX_ERR=y
    CONFIG_LOG_FUNC_NAME_PREFIX_WRN=y
    CONFIG_LOG_FUNC_NAME_PREFIX_INF=y
    CONFIG_LOG_FUNC_NAME_PREFIX_DBG=y
    
    CONFIG_LOG_MODE_DEFERRED=y
    CONFIG_LOG_SPEED=y
    CONFIG_LOG_BUFFER_SIZE=8192
    CONFIG_LOG_BLOCK_IN_THREAD=y
    
    CONFIG_USE_SEGGER_RTT=y
    CONFIG_LOG_BACKEND_RTT=y
    CONFIG_LOG_BACKEND_RTT_MODE_BLOCK=y
    
    CONFIG_TRACING=y
    CONFIG_TRACING_SYSCALL=y
    CONFIG_EXTRA_EXCEPTION_INFO=y
    CONFIG_ASSERT_VERBOSE=y
    

    Software versions:

    zephyr tag: "tag: v3.4.99-ncs1"

    JLink: SEGGER J-Link GDB Server V7.94e Command Line Version

    nRF connect for vscode: v2024.2.214

    Zephyr SDK: 0.16.5

    arm-zephyr-eabi-gdb --version: GNU gdb (Zephyr SDK 0.16.5) 12.1

    launch.json:

    {
        // Use IntelliSense to learn about possible attributes.
        // Hover to view descriptions of existing attributes.
        // For more information, visit: https://go.microsoft.com/fwlink/?linkid=830387
        "version": "0.2.0",
        "configurations": [
            {
                "type": "nrf-connect",
                "request": "launch",
                "name": "Launch active build configuration",
                "config": "${activeConfig}",
                "flash": false,
                "logging": {
                    "programOutput": true,
                    "engineLogging": false,
                    "trace": false,
                    "traceResponse": false
                },
                "gdbPath": "arm-zephyr-eabi-gdb",
                "serverArgs": "-if swd -device nRF52840_xxAA -select usb=${snr} -speed 4000 -port ${port} -singlerun -nogui -halt -noir -nosilent -rtos ${rtosPlugin}"
            },
        ]
    }

    Now to reproduce do:

    1. flash code to the board, frown the build folder I do: nrfjprog --recover --program zephyr/zephyr.hex  && nrfjprog --reset

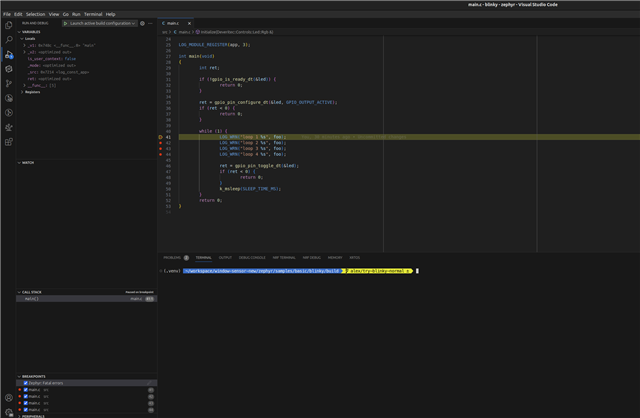
    2. set breakpoints as follows and start debugging, hit the first breakpoint:

    3. Stop the debugging (red square button)

    4. Remove all breakpoints ("zephyr: fatal errors" in bottom right is left active)

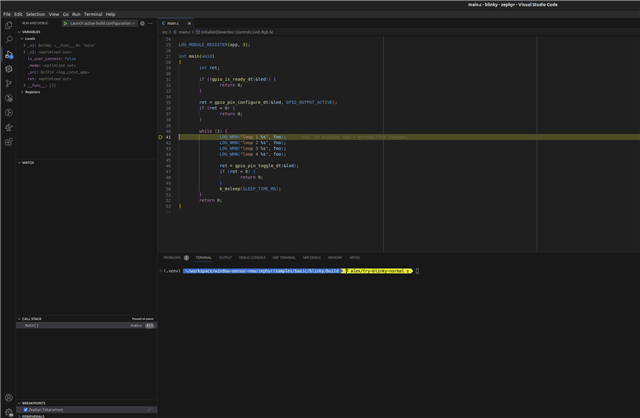
    5. Start debugging again, here is the problem, you will hit a ghost breakpoint:

    This is the state/problem that I am referring to. I it is not impossible to remove this breakpoint, except by reflashing the chip.

    Also you can see that power cycling does not solve the issue by unplugging and replugging the DK board, because you will see the LED being on most of the time, turning off for short period of time (definitely not 1 seconds as before). I think this is due to the board restarting when hitting the breakpoint, not sure.

    Also while searching for a minimal case where this is 100% reproducible I ran across several very strange problems which are probably related. For example:

    Comment out the following in prj.conf and repeat the exact steps from above.

    # CONFIG_CBPRINTF_NANO=y
    
    # CONFIG_LOG_FUNC_NAME_PREFIX_ERR=y
    # CONFIG_LOG_FUNC_NAME_PREFIX_WRN=y
    # CONFIG_LOG_FUNC_NAME_PREFIX_INF=y
    # CONFIG_LOG_FUNC_NAME_PREFIX_DBG=y

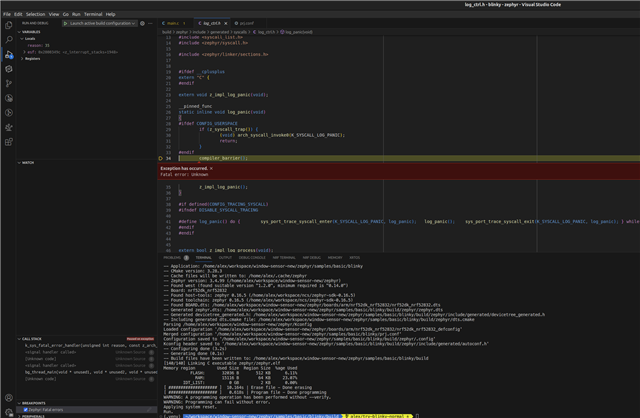
    Suddenly you will always land here:

    I hope you can reproduce this on your side?

  • Hi Elfving, sorry for the delay, I was on vacation last week.

    Have you tried this with a different DK as well?

    Not wit ha a different DK, but with a custom board based on on the same nrf52840 chip, the same problem is present there too.

    And you are using NCS 2.5.2?

    No, I'm on tag v2.5.0

    When you've run into any of these problems, could you try reading out the hex running on the device and send it to me?

    Sure, that makes sense! Actually I'm going to send you the zephyr.elf, the zephyr.hex and the hex that I read back after programming when the error occurred. The read back hex name is "nRF_Connect_Programmer_1711364771890-bug-present". Comparing it with the compiled and flashed zephyr.hex shows that it is almost entirely different except for a small section at the beginning and end which seems to be the same.

    I was curious to read back the hex directly after flashing. This file is named "nRF_Connect_Programmer_1711365158647-directly-after-flashing". As expected there is a diff:

    $ diff nRF_Connect_Programmer_1711364771890-bug-present nRF_Connect_Programmer_1711365158647-directly-after-flashing                                                            
    64c64
    < :1003E0000B68394A112128469847002865DB00BE72
    ---
    > :1003E0000B68394A112128469847002865DBDFF859
    68c68
    < :100420004FF4125100F0DCFF00BE04D0DBF80030C6
    ---
    > :100420004FF4125100F0DCFFD7F804D0DBF80030B5

    With the provided zephyr.hex and zephyr.elf you should be able to exactly reproduce the problem, unless of course it is due to some other system software differences.

    Here is the zip with everything:

    elf-and-hex-with-bug.zip

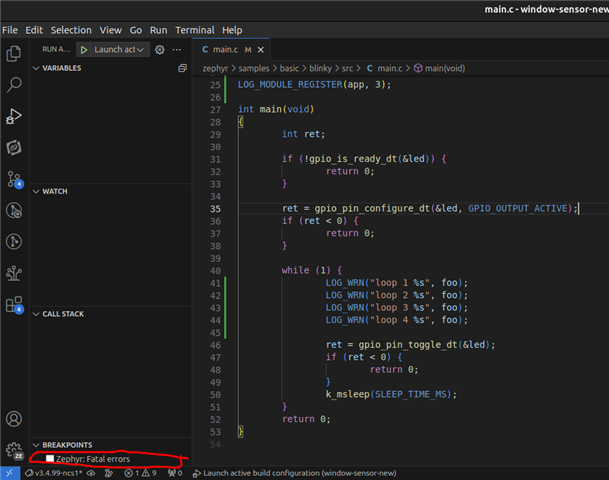
    Could you expand a bit on this part?

    Sorry for the confusion, I marked what I meant with red in this screenshot. It doesn't matter though, the error occurs regardless if "Zephyr: Fatal Errors" breakpoint option is enabled or not.

    And it also won't continue blinking if you simply reset it after stopping the debugging?

    It will kind of "blink", but this is just how the error manifests. You will notice that the blinking pattern changes, because the board will be in a reboot loop. Instead of LED bein on and off for 1 second, it will be on most of the time and turned off only briefly (during init code running after reboot).

  • Hello again and sorry about the wait, Easter is a public holiday in Norway.

    There is no development on this issue from your side?

    lx_brz said:

    I was curious to read back the hex directly after flashing. This file is named "nRF_Connect_Programmer_1711365158647-directly-after-flashing". As expected there is a diff:

    Im seeing a minor difference similar to this with a basic sample as well. I believe the stack is immediately writing something to flash, causing it. 

    Could you send me the project and build folder? I wasn't able to reproduce this from my side earlier, but I am seeing the issue you are describing on this hex file.

    Regards,

    Elfving

  • Hi Elfving,

    sorry again for the delay.

    > There is no development on this issue from your side?

    Unfortunately no, I'm out of ideas on what I can do on my end.

    > Could you send me the project and build folder? I wasn't able to reproduce this from my side earlier, but I am seeing the issue you are describing on this hex file.

    Sure, please find it attached. Please note that I switched from the nrf52dk_nrf52832 to the nrf52840dk_nrf52840 because I could not find the other board right now. It doesn't matter though, the issue is the same, I have just reproduced it again as described. It is always 100% reproducible. One more note, I have also updated to the newest nordic SDK v3.5.99-ncs1

    3581.blinky.zip


  • Hi,

    Are you seeing the same issue with these hexes? 

    840hisBuild.hex

    840Mybuild.hex

    I am not really seeing much response from my '840DK when flashing it with the zephyr.hex from your build folder.

    Regards,

    Elfving

  • Hi Elfving,

    Are you seeing the same issue with these hexes? 

    The hexes both seem to behave the same, the LED blinks as expected.

    I connected via JLinkRTTViewer and can see in your hex you added a counter to count the pauses.

    I am not really seeing much response from my '840DK when flashing it with the zephyr.hex from your build folder.

    This is very strange, I also did not get any repsonse (only a slight flickering in the LED, that one can barely see). After power cycling the board the LED started to work as expected. I have no idea what is happening here.

    I attached again an archive of my build folder. Also I attached a video to show you the bug as I am experiencing it, maybe it helps to understand it better.

    1667.blinky.zip

Reply
  • Hi Elfving,

    Are you seeing the same issue with these hexes? 

    The hexes both seem to behave the same, the LED blinks as expected.

    I connected via JLinkRTTViewer and can see in your hex you added a counter to count the pauses.

    I am not really seeing much response from my '840DK when flashing it with the zephyr.hex from your build folder.

    This is very strange, I also did not get any repsonse (only a slight flickering in the LED, that one can barely see). After power cycling the board the LED started to work as expected. I have no idea what is happening here.

    I attached again an archive of my build folder. Also I attached a video to show you the bug as I am experiencing it, maybe it helps to understand it better.

    1667.blinky.zip

Children
  • So the one called 840hisBuild.hex should be the one from your buildfolder, so it would be strange if that now acts as expected. Maybe there are some issues here with the flashing itself. Have you made sure that the switches are in the right positions and nRF Power source is set to VDD? Is anything shorted on the board?

    Power cycling the board after flashing is either way a good idea. 

    lx_brz said:

    I attached again an archive of my build folder. Also I attached a video to show you the bug as I am experiencing it, maybe it helps to understand it better.

    Great, I'll have a look at this debugger issue again later this week. 

    Regards,

    Elfving

  • So the one called 840hisBuild.hex should be the one from your buildfolder, so it would be strange if that now acts as expected. Maybe there are some issues here with the flashing itself. Have you made sure that the switches are in the right positions and nRF Power source is set to VDD? Is anything shorted on the board?

    It is the same file, yes. Why would it be strange that everything is as expected? The issue occurs after flashing this file and setting breakpoints via the nrf extension. If I just flash the file and don't try to debug it and to set breakpoints, then there are no problems, which is expected.

    With regard to hardware everything should be ok, no shorts and nothing. Also this issue occurs on another board. And additionally as I have written at the very top, this problem does not occur with the "cortex-debug" extension, only with the official nrf extension.

    Maybe there is still a misunderstanding about what the problem exactly is? Could you please watch the video? It should make the problem  quite obvious.

    Thanks

    Alex

Related