Firmware not running on custom hardware, working on devkit - nRF5340

Hello, I have the following problem. I am total newbie in nRF programming, so I have minimal knowledge about that hardware.

I have bought nRF5340-DK earlier, firmware on it is working properly.
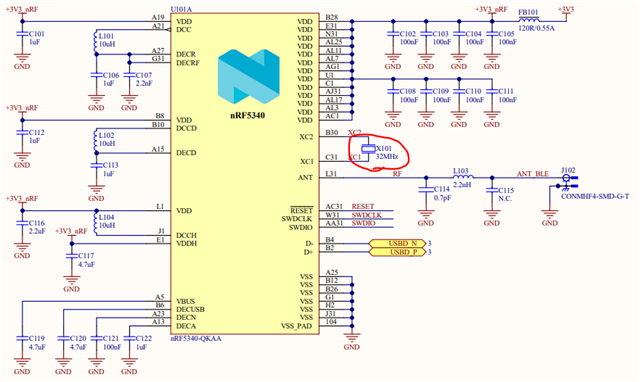
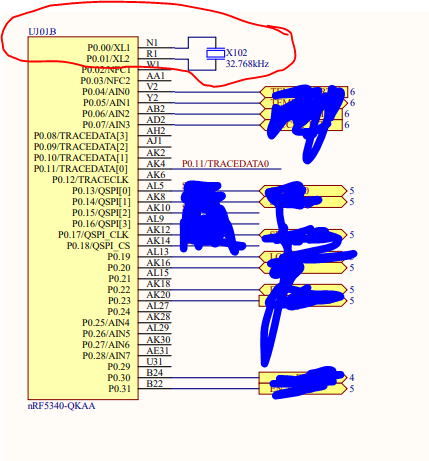
Then there was created custom hardware for sme that has nRF5340 chip onboard, exactly part number NRF5340-QKAA-R.

There are programming pins onboard next to the chip, that I can use for programming it with following pinout:

So for my purpose there were used pins such as: 3V3, GND, SWDIO, SWDCLK and RESET.

I have used ST-link V2 interface that I have reflashed to J-link, so it acts as J-link now.
I have also downloaded J-link installation, drivers.

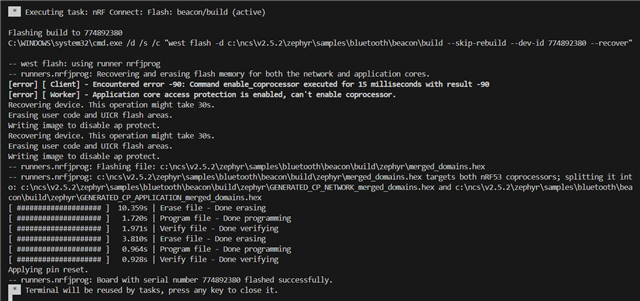
So I have created build. Then I flashed it to the nRF chip.
There I had to click to overwrite, as it has protection for writing new firmware (same bahaviour as in case of NRF5340-DK devkit.

Firmware was uploaded, also verification was performed, everything ended with status OK.
But firmware is NOT running. I don't see any Bluetooth broadcast from this chip.
From devkit I see it immediately after programming. 

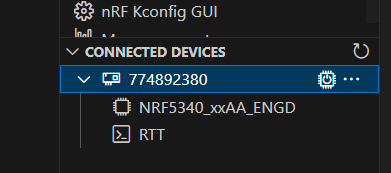
When I open VS Code from nRF Connect - Toolchain, 
I see J-link interface there and also when I click on it, I see nRF5340 there.
I don't have any COM port in Terminal tab, so I cannot see what board is doing.

About that P0.11/TRACEDATA0 pin, for what it is used? Some kind of debug or serial interface?

I am thinking there I need to upload bootloader or something, but dont know why. Sample named bluetooth can't be compiled for my CPU target. 
Totally I haven't found what I need to download or how to upload bootloader. There is simply no guide for this. Or can it be something else? Please help, how to fix it.

Everything looks like VS Code is communicating with microcontroller, as I see verification and it is okay, so firmware was uploaded into nRF's flash memory.
Tomorrow I can add some output from VS Code during upload etc.

Firmware was identical for devkit or for standalone chip, no changes there.

  • Looks like everything is there.
    Can't be problem like just app core was uploaded but network one not?
    Some clue how to debug this? I dont have access to any other pins, also there is no LED on the PCB, so I can't blink... with any.


  • Based on Output, everything is uploaded properly. But firmware does not run.


    If firmware is running I will see in BLE scan available device.
    Works only with devkit nRF5340. I have tried also to reattach the board after upload, also tried to power it up using battery, but still no success.

  • Have you tuned your antenna? Or is the matching antenna matching network missing?

    Another thing, I see from the schematic that VDDH is connected to VDD which enables Normal voltage mode. In this mode the inductor L104 is as well as C116 and C117 are not needed, as according to circuit config. no. 2. However, I do not think this necessarily would cause the issue you are seeing.

    You should also make sure to enable the DCDC for Normal mode (VREGMAIN) as well as disable the high voltage regulator (VREGH): 
    CONFIG_BOARD_ENABLE_DCDC_APP=y
    CONFIG_BOARD_ENABLE_DCDC_NET=y
    CONFIG_BOARD_ENABLE_DCDC_HV=n

    If your project contains a bootloader you would have to include the above in the .conf file for the bootlader as well.

    martin.ch said:
    Some clue how to debug this? I dont have access to any other pins, also there is no LED on the PCB, so I can't blink.

    Is perhaps P0.11 on J101 available for blinking an LED?

  • As Helsing points out, you do have a debug output: "Serial wire output (SWO) trace of ITM data" which can be used to blink an LED but also as a printf-style text output stream. Here is a test function to output some text, I forget where I used this but there will be references in the devzone from other posters. This was used on nRF52832 or nRF52840 so might require editing for the nRF5340 (see Section 8.9 Enabling the Trace Port)

    #define SWO_OUTPUT_PIN   11
    void TestSWO(void)
    {
       // Enable SWO trace functionality on GPIO pin
       CoreDebug->DEMCR |= CoreDebug_DEMCR_TRCENA_Msk;
       NRF_CLOCK->TRACECONFIG |= CLOCK_TRACECONFIG_TRACEMUX_Serial << CLOCK_TRACECONFIG_TRACEMUX_Pos;
       // This is a serial output debug pin
       NRF_P0->PIN_CNF[SWO_OUTPUT_PIN] = (GPIO_PIN_CNF_DRIVE_H0H1 << GPIO_PIN_CNF_DRIVE_Pos) | (GPIO_PIN_CNF_INPUT_Connect << GPIO_PIN_CNF_INPUT_Pos) | (GPIO_PIN_CNF_DIR_Output << GPIO_PIN_CNF_DIR_Pos);
       // Set Data Watchpoint and Trace (DWT) register
       DWT->CTRL |= 0x103FF;
       // Enable trace port debug interface at 4MHz
       NRF_CLOCK->TRACECONFIG = (NRF_CLOCK->TRACECONFIG & ~CLOCK_TRACECONFIG_TRACEPORTSPEED_Msk) | (CLOCK_TRACECONFIG_TRACEPORTSPEED_4MHz << CLOCK_TRACECONFIG_TRACEPORTSPEED_Pos);
       // Enable the ITM stimulus
       ITM->LAR = 0xC5ACCE55;   // 0xFB0 ( /W)  ITM Lock Access Register, enables write access to Control Register 0xE00::0xFFC
       ITM->TCR |= 9;//1;       // 0xE80 (R/W)  ITM Trace Control Register
       ITM->TPR |= 1;           // 0xE40 (R/W)  ITM Trace Privilege Register
       ITM->TER |= 1;           // 0xE00 (R/W)  ITM Trace Enable Register
    #if 0
       uint32_t SWO_BaudRate = 57600;
       uint32_t SWO_Prescaler = (CPU_CORE_FREQUENCY_HZ / SWO_BaudRate) + 1; // SWOSpeed in Hz, note that CPU_CORE_FREQUENCY_HZ is expected to be match the CPU core clock
       CoreDebug->DEMCR = CoreDebug_DEMCR_TRCENA_Msk;                // enable trace in core debug
       *((volatile unsigned *)(ITM_BASE + 0x400F0)) = 0x00000002;    // "Selected PIN Protocol Register": Select which protocol to use for trace output (2: SWO NRZ, 1: SWO Manchester encoding)
       *((volatile unsigned *)(ITM_BASE + 0x40010)) = SWO_Prescaler; // "Async Clock Prescaler Register". Scale the baud rate of the asynchronous output
       *((volatile unsigned *)(ITM_BASE + 0x00FB0)) = 0xC5ACCE55;    // ITM Lock Access Register, C5ACCE55 enables more write access to Control Register 0xE00 :: 0xFFC
       ITM->TCR = ITM_TCR_TraceBusID_Msk | ITM_TCR_SWOENA_Msk | ITM_TCR_SYNCENA_Msk | ITM_TCR_ITMENA_Msk; // ITM Trace Control Register
       ITM->TPR = ITM_TPR_PRIVMASK_Msk; // ITM Trace Privilege Register
       ITM->TER = 1;                    // ITM Trace Enable Register. Enabled tracing on stimulus ports. One bit per stimulus port
       *((volatile unsigned *)(ITM_BASE + 0x01000)) = 0x400003FE; // DWT_CTRL
       *((volatile unsigned *)(ITM_BASE + 0x40304)) = 0x00000100; // Formatter and Flush Control Register
    #endif
       uint8_t c = '0';
       for (uint32_t i=0; i<40; i++)
       {
          ITM_SendChar(c++);
          c %= '0'+10;
       }
       ITM_SendChar('\r'); ITM_SendChar('\n');
       // Disable SWO trace functionality on GPIO pin, revert to GPIO
       CoreDebug->DEMCR &= ~CoreDebug_DEMCR_TRCENA_Msk;
       NRF_CLOCK->TRACECONFIG |= CLOCK_TRACECONFIG_TRACEMUX_GPIO << CLOCK_TRACECONFIG_TRACEMUX_Pos;
    }

    Edit: Here's an earlier post: swo-signal-inversion-bug

    Edit2: From NickT:

    "When (Cortex M-series) target enters true low power mode (in the absence of debug connection) due to a sleep event and there is data in the ITM/TPIU that has not been flushed, then the data stream gets mangled with garbage due to what appears to be clock gating/changes when core transitions to sleep."

    After I disabled the sd_app_evt_wait() call in our project the SWO is 100% reliable as a uart output.

Related