Porting nRF Desktop to Xiao BLE Sense - RunTime problems

Hello folks,

I'm continuing a project that involves porting nRF Desktop (https://www.nordicsemi.com/Products/Reference-designs/nRF-Desktop) to the Xiao BLE Sense.

Previously, I had miniaturized the nRF Desktop code, and ran into deviceTree-based build problems which I resolved with the help of another post. (That post is here:  Porting nRF Desktop to Xiao BLE Sense) After some lateral development on other elements of my project I'm back to this.

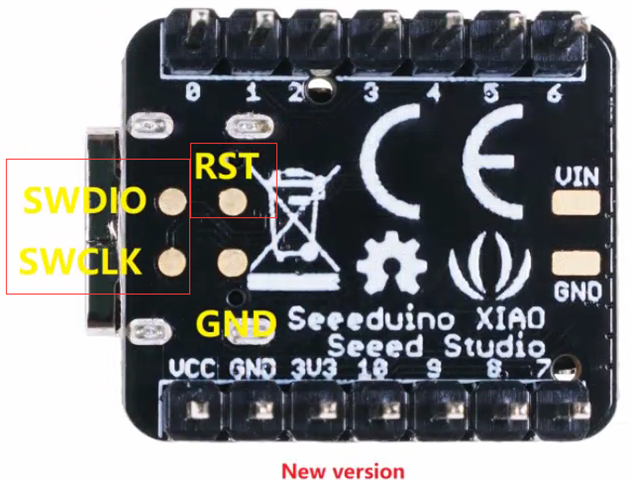
As before, I'm working on Win 11, nRF52840 devKit porting to the Xiao BLE Sense, and using toolchain v2.5.0

The solution to my build problem was with the entropy model, and was fixed by the solution in the previous post.

With that modification, the code builds, flashes, and does some of what it's meant to do. But things get weird.

===== The problem =====

After building and uploading my code to Xiao, I lose the COM port connection for the serial monitor. After losing the COM port, the device correctly shows up on Bluetooth. Attempting to pair with the device fails, and after a few seconds, the computer throws an error about the "USB Device is Not Recognized."

Using printk statements to figure out how far into the code I'm getting, I observe that I enter "main", get past "app_event_manager_init" and get TO "module_set_state(MODULE_STATE_READY)", but the console fails before any events are triggered, and so I lose the ability to debug on Xiao.

===== The Question =====

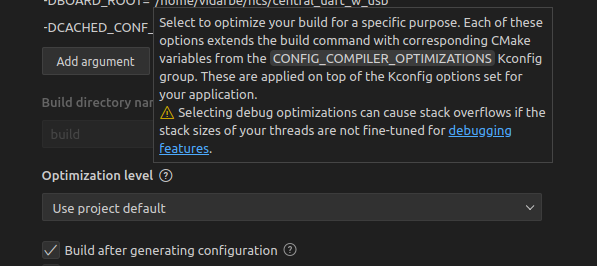
I'd love to be able to debug, what can I do to keep the console up and running?

Do you (Nordic Engineers) have ideas about what might be causing this?

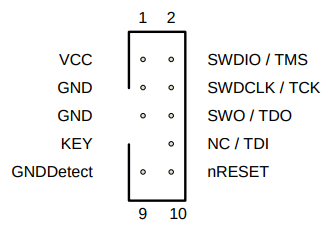
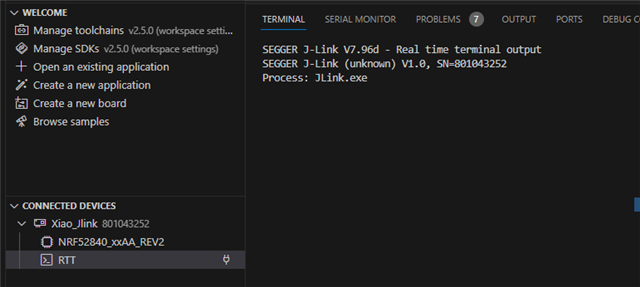
Alternatively, if this system is too much of a black box, does it seem like the only way forward is to purchase a JLink system and use that as an active debugger on this hardware?

I'll keep experimenting over the next few days, but having a hardware-specific fault that kills my logging is a tough place to be.

Grateful as always for any help you can provide,

    - Finn

Parents
  • Hello Finn,

    I would definelty recommend getting a debugger or an nRF52840 DK, which includes a Debug output port for programming external targets. This makes the debugging experience more seamless. Additionally, you won't lose the logger connection if the firmware crashes, since the USB UART bridge is located on the debugger itself.

    After building and uploading my code to Xiao, I lose the COM port connection for the serial monitor. After losing the COM port, the device correctly shows up on Bluetooth. Attempting to pair with the device fails, and after a few seconds, the computer throws an error about the "USB Device is Not Recognized."

    Using printk statements to figure out how far into the code I'm getting, I observe that I enter "main", get past "app_event_manager_init" and get TO "module_set_state(MODULE_STATE_READY)", but the console fails before any events are triggered, and so I lose the ability to debug on Xiao.

    Please try to add CONFIG_RESET_ON_FATAL_ERROR=n (and CONFIG_LOG=y if not enabled already) to your prj.conf file to see if you can get a crashlog from the device.

    Best regards,

    Vidar

  • Hi Vidar,

    Thanks for the speedy response!

    I've got an nRF52840 DK -- the target application works as expected on that system. Could you please point me to documentation for using my DK as a debugger for an external board?

    CONFIG_RESET_ON_FATAL_ERROR=n and CONFIG_LOG=y are both enabled.

    I do not get any crash-log.

    This code

    #include <app_event_manager.h>

    #define MODULE main
    #include <caf/events/module_state_event.h>

    #include <zephyr/logging/log.h>
    LOG_MODULE_REGISTER(MODULE);

    #define WAIT 1000

    int main(void)
    {
        k_msleep(2*WAIT);
        printk("TEST!\n");
        k_msleep(WAIT);
        if (app_event_manager_init()) {
            k_msleep(WAIT);
            LOG_ERR("Application Event Manager not initialized");
        } else {
            k_msleep(WAIT);
            printk("Else!\n");
            k_msleep(WAIT);
            module_set_state(MODULE_STATE_READY);
            k_msleep(WAIT);
            printk("State Set!\n");
        }
        return 0;
    }

    Yields this output

    ---- Reopened serial port COM52 ----
    TEST!
    Else!

    I've purchased a segger JLINK which will arrive Friday.

    Do you have any other advice for continuing to debug this behavior?

    Thank you,

        - Finn

  • Hi Finn,

    Sorry for the delayed response. Did you receive the JLINK debugger? In that case, were you able to determine if the program entered the error handler? 

    Best regards,

    Vidar

  • Hi Vidar,

    I am also sorry for my delayed response. I've been personally and professionally busy lately.

    Yes, my JLink arrived and I'm back to productive.

    Unfortunately, I have not yet determined the program's behavior. I am wrestling with the actual setup of the JLink - I've set up the following

    (Plus the JTAG ground pin 5 to the Xiao GND pin, and the JTAG VCC pin 1 to the VCC on Xiao)

    This successfully connects Xiao to my computer

    And in JLink settings I've configured the board as an nRF52840_xxAA.

    However, although it seems I can use basic utilities like "reset board' and "erase and flash", I am unable to get serial terminal output from Xiao (the device does not show up on a COM port).

    Thus far, attempts at debugging (an otherwise perfectly functional test program) lead to the following output from Debug console

    JLinkGDBServerCL: SEGGER J-Link GDB Server V7.96d Command Line Version
    JLinkGDBServerCL: 
    JLinkGDBServerCL: JLinkARM.dll V7.96d (DLL compiled Apr 10 2024 08:30:46)
    JLinkGDBServerCL: 
    JLinkGDBServerCL: -----GDB Server start settings-----
    JLinkGDBServerCL: GDBInit file:                  none
    JLinkGDBServerCL: GDB Server Listening port:     63113
    JLinkGDBServerCL: SWO raw output listening port: 2332
    JLinkGDBServerCL: Terminal I/O port:             2333
    JLinkGDBServerCL: Accept remote connection:      localhost only
    JLinkGDBServerCL: Generate logfile:              off
    JLinkGDBServerCL: Verify download:               off
    JLinkGDBServerCL: Init regs on start:            off
    JLinkGDBServerCL: Silent mode:                   on
    JLinkGDBServerCL: Single run mode:               on
    JLinkGDBServerCL: Target connection timeout:     0 ms
    JLinkGDBServerCL: ------J-Link related settings------
    JLinkGDBServerCL: J-Link Host interface:         USB
    JLinkGDBServerCL: J-Link script:                 none
    JLinkGDBServerCL: J-Link settings file:          none
    JLinkGDBServerCL: ------Target related settings------
    JLinkGDBServerCL: Target device:                 nRF52840_xxAA
    JLinkGDBServerCL: Target device parameters:      none
    JLinkGDBServerCL: Target interface:              SWD
    JLinkGDBServerCL: Target interface speed:        12000kHz
    JLinkGDBServerCL: Target endian:                 little
    JLinkGDBServerCL: 
    =thread-group-added,id="i1"
    =cmd-param-changed,param="pagination",value="off"
    0xfffffffe in ?? ()
    [New Remote target]
    [New Thread 1502456040]
    

    I'll keep trying to resolve this on my end. Rather than keeping you in suspense, I'd love to ask if you have any advice for resolving this.

    Thank you,

        - Finn

Reply
  • Hi Vidar,

    I am also sorry for my delayed response. I've been personally and professionally busy lately.

    Yes, my JLink arrived and I'm back to productive.

    Unfortunately, I have not yet determined the program's behavior. I am wrestling with the actual setup of the JLink - I've set up the following

    (Plus the JTAG ground pin 5 to the Xiao GND pin, and the JTAG VCC pin 1 to the VCC on Xiao)

    This successfully connects Xiao to my computer

    And in JLink settings I've configured the board as an nRF52840_xxAA.

    However, although it seems I can use basic utilities like "reset board' and "erase and flash", I am unable to get serial terminal output from Xiao (the device does not show up on a COM port).

    Thus far, attempts at debugging (an otherwise perfectly functional test program) lead to the following output from Debug console

    JLinkGDBServerCL: SEGGER J-Link GDB Server V7.96d Command Line Version
    JLinkGDBServerCL: 
    JLinkGDBServerCL: JLinkARM.dll V7.96d (DLL compiled Apr 10 2024 08:30:46)
    JLinkGDBServerCL: 
    JLinkGDBServerCL: -----GDB Server start settings-----
    JLinkGDBServerCL: GDBInit file:                  none
    JLinkGDBServerCL: GDB Server Listening port:     63113
    JLinkGDBServerCL: SWO raw output listening port: 2332
    JLinkGDBServerCL: Terminal I/O port:             2333
    JLinkGDBServerCL: Accept remote connection:      localhost only
    JLinkGDBServerCL: Generate logfile:              off
    JLinkGDBServerCL: Verify download:               off
    JLinkGDBServerCL: Init regs on start:            off
    JLinkGDBServerCL: Silent mode:                   on
    JLinkGDBServerCL: Single run mode:               on
    JLinkGDBServerCL: Target connection timeout:     0 ms
    JLinkGDBServerCL: ------J-Link related settings------
    JLinkGDBServerCL: J-Link Host interface:         USB
    JLinkGDBServerCL: J-Link script:                 none
    JLinkGDBServerCL: J-Link settings file:          none
    JLinkGDBServerCL: ------Target related settings------
    JLinkGDBServerCL: Target device:                 nRF52840_xxAA
    JLinkGDBServerCL: Target device parameters:      none
    JLinkGDBServerCL: Target interface:              SWD
    JLinkGDBServerCL: Target interface speed:        12000kHz
    JLinkGDBServerCL: Target endian:                 little
    JLinkGDBServerCL: 
    =thread-group-added,id="i1"
    =cmd-param-changed,param="pagination",value="off"
    0xfffffffe in ?? ()
    [New Remote target]
    [New Thread 1502456040]
    

    I'll keep trying to resolve this on my end. Rather than keeping you in suspense, I'd love to ask if you have any advice for resolving this.

    Thank you,

        - Finn

Children
  • Hello Finn,

    If you want debug logs over the SWD debug interface, you need to enable the RTT logger backend. The UART pins are not connected to the debug probe when you use a standalone J-link debugger, unlike the on-board J-Link on our development kits.

    https://developer.nordicsemi.com/nRF_Connect_SDK/doc/2.6.0/nrf/test_and_optimize/logging.html#logging-backends 

    Best regards,

    Vidar

  • Hi Vidar,

    That pointer was much appreciated. I was debugging up the wrong tree. I got the SWD logger working, and I now have a log of exactly what's going wrong in the Xiao Build of my modified nRF Desktop app.

    TEST!
    Else!
    [00:00:48.623,077] <inf> power_manager: Activate power manager
    --- 4 messages dropped ---
    [00:00:48.623,199] <inf> app_event_manager: e:module_state_event module:board state:READY
    [00:00:48.623,260] <inf> app_event_manager: e:module_state_event module:hids state:READY
    [00:00:48.623,321] <inf> app_event_manager: e:led_event led_id:0 effect:0x777a8
    [00:00:48.623,413] <inf> app_event_manager: e:module_state_event module:buttons state:READY
    [00:00:48.623,504] <inf> app_event_manager: e:module_state_event module:click_detector state:READY
    [00:00:48.623,596] <inf> app_event_manager: e:module_state_event module:leds state:READY
    [00:00:48.627,502] <inf> ble_state: Bluetooth initialized
    [00:00:48.627,685] <inf> app_event_manager: e:module_state_event module:ble_state state:READY
    [00:00:48.627,777] <inf> app_event_manager: e:led_ready_event led_id:0 effect:0x777a8
    [00:00:48.627,838] <inf> app_event_manager: e:module_state_event module:bas state:READY
    [00:00:48.632,202] <inf> settings_loader: Settings loaded
    [00:00:48.632,293] <inf> app_event_manager: e:module_state_event module:settings_loader state:READY
    [00:00:48.632,324] <inf> ble_bond: Device has 3 identities
    [00:00:48.632,354] <inf> ble_bond: Selected BLE peers
    [00:00:48.632,476] <inf> app_event_manager: e:ble_peer_operation_event SELECTED bt_app_id=0 bt_stack_id=0
    [00:00:48.632,568] <inf> app_event_manager: e:module_state_event module:ble_bond state:READY
    [00:00:48.632,629] <inf> ble_adv: Use fast advertising
    [00:00:48.634,948] <inf> ble_adv: Advertising started
    [00:00:48.635,040] <inf> app_event_manager: e:led_event led_id:1 effect:0x77708
    ASSERTION FAIL [event->led_id < ((size_t) (((int) sizeof(char[1 - 2 * !(!__builtin_types_compatible_p(__typeof__(leds), __typeof__(&(leds)[0])))]) - 1) + (sizeof(leds) / sizeof((leds)[0]))))] @ WEST_TOPDIR/nrf/subsys/caf/modules/leds.c:244
    [00:00:48.635,101] <err> os: r0/a1:  0x00000004  r1/a2:  0x000000f4  r2/a3:  0x00000018
    [00:00:48.635,101] <err> os: r3/a4:  0x000000f4 r12/ip:  0x00000004 r14/lr:  0x00061c130m
    [00:00:48.635,131] <err> os:  xpsr:  0x61000000
    [00:00:48.635,162] <err> os: Faulting instruction address (r15/pc): 0x0006cbda
    [00:00:48.635,192] <err> os: >>> ZEPHYR FATAL ERROR 4: Kernel panic on CPU 0
    [00:00:48.635,253] <err> os: Current thread: 0x200034d0 (sysworkq)
    [00:00:49.562,011] <err> os: Halting system

    I figured I'd send my update as soon as I had a breakthrough. I'll keep working on my end but I figured this would be useful information for folks who run into something similar.

    Thank you,

        - Finn

  • Hmm.

    I ran the debug and observed that the fault was occurring in the CAF Led module.

    Xiao BLE Sense has (by default) only one PWM led (the charge indicator light).

    The above fault (previous message) was occurring when trying to set up an LED at index 1, and it would fault because LED 1 did not exist.

    To fix this, I pulled from an earlier experiment of mine in which I played with all 4 LEDs as PWM controllers and listed the built in RGB 3-color LED as pwm_leds 1, 2, and 3. (Charge indicator is 0)

    Now, instead of entering the debugger and walking the list of LEDS, it fails before reaching main.

    SEGGER J-Link V7.96d - Real time terminal output
    SEGGER J-Link (unknown) V1.0, SN=801043252
    Process: JLink.exe
    [00:00:00.011,474] <err> os: ***** HARD FAULT *****
    [00:00:00.011,505] <err> os:   Fault escalation (see below)
    [00:00:00.011,505] <err> os: ***** MPU FAULT *****
    [00:00:00.011,535] <err> os:   Data Access Violation
    [00:00:00.011,566] <err> os:   MMFAR Address: 0x20008fba
    [00:00:00.011,566] <err> os: r0/a1:  0x00000000  r1/a2:  0x4001e700  r2/a3:  0x00000002
    [00:00:00.011,596] <err> os: r3/a4:  0x00000000 r12/ip:  0x00000000 r14/lr:  0x0003040d
    [00:00:00.011,596] <err> os:  xpsr:  0x61000000
    [00:00:00.011,627] <err> os: Faulting instruction address (r15/pc): 0x00030432
    [00:00:00.011,657] <err> os: >>> ZEPHYR FATAL ERROR 19: Unknown error on CPU 0
    [00:00:00.011,718] <err> os: Current thread: 0x20003498 (main)
    [00:00:01.180,572] <err> os: Halting system

  • Hi Finn,

    It is good to see that you found the reason for the previous assertion. Regarding the last fault, it appears to be caused by a stack overflow in the main thread. I recommend you try increasing the main thread's stack size. This can be done through the CONFIG_MAIN_STACK_SIZE symbol. E.g., by adding CONFIG_MAIN_STACK_SIZE=4096 to your prj.conf file.

    Note: the stack usage increases if you change the default optimization level here: 

    Vidar

Related