Can't flash asset tracking sample code getting the fatal error.

Hi,
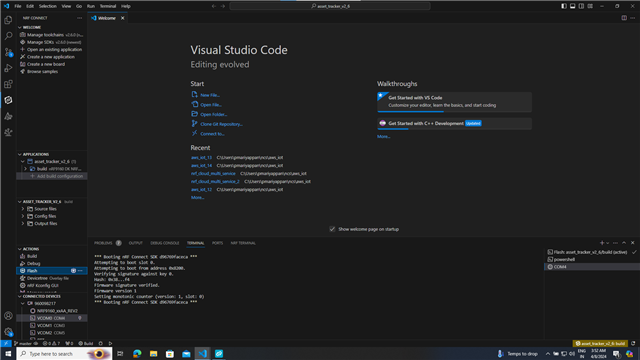
     im using nRF9160dk ,sdk version 2.5.1 .When I open the sample code of  asset tracking v2 application code I can successfully build the code but when I tried to flash the code I'm getting this fatal error ,but I can flash remaining code like nRF cloud multiservice code and all sample codes successfully and got output also but why I can't flash asset tracking code.below I shared the error.

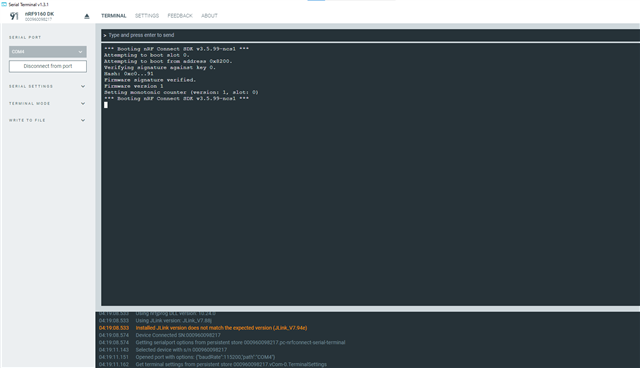
Building asset_tracker_v2_1
C:\Windows\system32\cmd.exe /d /s /c "west build --build-dir c:/Users/mdharumalingam/aws_iot_1/asset_tracker_v2_1/build c:/Users/mdharumalingam/aws_iot_1/asset_tracker_v2_1"

[0/47] Performing build step for 'mcuboot_subimage'
ninja: no work to do.
[1/38] Performing build step for 'b0_subimage'
ninja: no work to do.
[2/35] Performing build step for 's1_image_subimage'
ninja: no work to do.
[3/27] Performing build step for 'tfm'
ninja: no work to do.
* Terminal will be reused by tasks, press any key to close it.

* Executing task: nRF Connect: Flash: asset_tracker_v2_1/build (active)

Flashing build to 960098217
C:\Windows\system32\cmd.exe /d /s /c "west flash -d c:\Users\mdharumalingam\aws_iot_1\asset_tracker_v2_1\build --skip-rebuild --dev-id 960098217"

-- west flash: using runner nrfjprog
-- runners.nrfjprog: Flashing file: c:\Users\mdharumalingam\aws_iot_1\asset_tracker_v2_1\build\zephyr\merged.hex
[ #################### ] 12.269s | Erase file - Done erasing
[ #################### ] 2.944s | Program file - Done programming
[error] [ nRF91] - Failed while performing 'Verify' operation on target address 0x00FF8130.
-160: Data does not match in address range [0x00FF8130 - 0x00FF817F] (UICR)
Expected byte value 0xDC but read 0xC0 at address 0x00FF8140.
[error] [ nRF91] - Failed while verifying device. -160: Data does not match in address range [0x00FF8130 - 0x00FF817F] (UICR)
Expected byte value 0xDC but read 0xC0 at address 0x00FF8140.
[error] [ Worker] - Data does not match in address range [0x00FF8130 - 0x00FF817F] (UICR)
Expected byte value 0xDC but read 0xC0 at address 0x00FF8140.
[error] [ Client] - Encountered error -160: Command verify_file executed for 2983 milliseconds with result -160
ERROR: Write verify failed.
NOTE: For additional output, try running again with logging enabled (--log).
NOTE: Any generated log error messages will be displayed.
FATAL ERROR: command exited with status 25: nrfjprog --program 'c:\Users\mdharumalingam\aws_iot_1\asset_tracker_v2_1\build\zephyr\merged.hex' --sectorerase --verify -f NRF91 --snr 960098217

* The terminal process terminated with exit code: 25.
* Terminal will be reused by tasks, press any key to close it.


Parents
  • Hi,
         after updating the modem version 1.3.6 and sdk version to 2.6.0 also this time flashing asset tracking program getting like this what to do?

  • Hi,

    What you mean "getting like this"? Do you mean you still get "FATAL ERROR: command exited with status 25"?

    If so, could you try to build original "v2.6.0\nrf\applications\asset_tracker_v2" then recover board before programming?

    Best regards,

    Charlie

  • Hi,
        Thank you for your guidance. I followed the steps as suggested, including building the original asset tracker v2 code and performing board recovery before programming. However, I'm still encountering the same issue as before.I'm not receiving any output indicative of cloud connection or data publishing.

    I also attempted to directly flash the asset tracking code from the nRF desktop,

    but unfortunately, the results remain unchanged. Given these outcomes,


    do you have any further suggestions or troubleshooting steps I could try to resolve this issue?

  • Could you share me you nRF9160DK hardware version? 

    This may be related to external flash Application description — nRF Connect SDK 2.6.0 documentation (nordicsemi.com).

    Best regards,

    Charlie

  • Hi ,

    Thank you for your prompt response. My nRF9160DK hardware version is 1.1.0. Based on this information, could you please advise me on the next steps I should take to resolve the issue? Your guidance would be greatly appreciated.

    Best regards,

    Purushothaman 

  • Hi Purushothaman,

    I am also using nRF9160DK v1.1.0 now.

    Could you give a last try by programming thingy91_asset_tracker_v2_2024-03-13_af2b60d2.hex  with nRF Connect for Desktop->Programmer APP.

    If it still gives the same result, I also run out of idea why this happens.Please send me pictures of your nRF9160DK from both sides, just in case it is some HW issues.

    Best regards,

    Charlie

  • Hi,
        Thank you for your help. After following your instructions asset tracking code is producing log outputs without any issue.

    *** Booting nRF Connect SDK d96769faceca ***
    Attempting to boot slot 0.
    Attempting to boot from address 0x8200.
    Verifying signature against key 0.
    Hash: 0xb0...7c
    Firmware signature verified.
    Firmware version 1
    Setting monotonic counter (version: 1, slot: 0)
    *** Booting nRF Connect SDK d96769faceca ***
    *** Booting nRF Connect SDK d96769faceca ***
    [00:00:00.255,218] <inf> app_event_manager: APP_EVT_START
    [00:00:00.492,187] <inf> nrf_modem_lib_trace: Trace thread ready
    [00:00:00.499,816] <inf> nrf_modem_lib_trace: Trace level override: 2
    [00:00:00.500,061] <inf> app_event_manager: MODEM_EVT_INITIALIZED
    [00:00:00.572,937] <inf> app_event_manager: MODEM_EVT_LTE_CONNECTING
    [00:00:01.291,320] <inf> app_event_manager: DATA_EVT_CONFIG_INIT
    %CESQ: 65,3,18,2
    +CEREG: 2,"4006","034A1710",7
    [00:00:01.832,885] <inf> app_event_manager: MODEM_EVT_LTE_CELL_UPDATE
    +CSCON: 1
    %CESQ: 67,3,23,3
    +CGEV: ME PDN ACT 0,0
    [00:00:03.045,684] <inf> app_event_manager: MODEM_EVT_LTE_CONNECTED
    [00:00:03.047,149] <inf> app_event_manager: CLOUD_EVT_CONNECTING
    +CNEC_ESM: 50,0
    %MDMEV: SEARCH STATUS 2
    +CEREG: 1,"4006","034A1710",7,,,"00001010","11000001"
    [00:00:03.051,910] <inf> app_event_manager: MODEM_EVT_LTE_PSM_UPDATE
    %XTIME: "0A","4240511143610A","01"
    [00:00:03.071,441] <inf> app_event_manager: DATA_EVT_DATE_TIME_OBTAINED
    [00:00:06.409,057] <inf> app_event_manager: CLOUD_EVT_CONFIG_RECEIVED
    [00:00:06.413,360] <inf> app_event_manager: DATA_EVT_CONFIG_SEND
    [00:00:06.414,337] <inf> app_event_manager: CLOUD_EVT_DATA_SEND_QOS
    [00:00:07.137,115] <inf> app_event_manager: CLOUD_EVT_CONNECTED
    [00:00:07.138,488] <inf> app_event_manager: APP_EVT_DATA_GET - Requested data types (MOD_DYN, MOD_STAT, BAT, ENV, LOCATION)
    [00:00:07.139,282] <inf> app_event_manager: LOCATION_MODULE_EVT_ACTIVE
    [00:00:07.141,113] <inf> app_event_manager: SENSOR_EVT_ENVIRONMENTAL_NOT_SUPPORTED
    [00:00:07.142,120] <inf> app_event_manager: SENSOR_EVT_FUEL_GAUGE_NOT_SUPPORTED
    [00:00:07.142,791] <inf> app_event_manager: LOCATION_MODULE_EVT_AGNSS_NEEDED
    [00:00:07.210,906] <inf> app_event_manager: MODEM_EVT_MODEM_STATIC_DATA_READY
    [00:00:07.325,744] <inf> app_event_manager: MODEM_EVT_MODEM_DYNAMIC_DATA_READY
    +CSCON: 0
    %CESQ: 255,0,255,0
    [00:01:41.825,103] <wrn> location: GNSS timed out possibly due to too short GNSS time windows
    %CESQ: 64,3,18,2
    %CESQ: 68,3,23,3
    %NCELLMEAS: 0,"034A1710","310410","4006",65535,5110,49,70,28,101853,0
    %NCELLMEAS: 0,"034A1710","310410","4006",65535,0,5110,49,70,27,102030,0,0,"0052A40C","310260","A2E3",65535,0,1026,22,36,22,102039,0,0
    %NCELLMEAS: 0,"034A1710","310410","4006",65535,0,5110,49,70,28,104004,0,0,"0052A40C","310260","A2E3",65535,0,1026,22,36,24,104013,0,0,"02982901","311580","1101",65535,0,5035,354,60,21,104022,0,0,"0328CB03","311480","CF03",65535,0,5230,146,54,23,104079,0,0
    [00:01:44.540,679] <inf> app_event_manager: LOCATION_MODULE_EVT_CLOUD_LOCATION_DATA_READY
    [00:01:44.541,351] <inf> app_event_manager: DATA_EVT_DATA_READY
    [00:01:44.552,551] <inf> app_event_manager: DATA_EVT_CLOUD_LOCATION_DATA_SEND
    [00:01:44.556,884] <inf> app_event_manager: DATA_EVT_DATA_SEND_BATCH
    [00:01:44.557,739] <inf> app_event_manager: CLOUD_EVT_DATA_SEND_QOS
    [00:01:44.557,983] <inf> app_event_manager: CLOUD_EVT_CLOUD_LOCATION_UNKNOWN
    [00:01:44.558,685] <inf> app_event_manager: LOCATION_MODULE_EVT_INACTIVE
    [00:01:44.559,906] <inf> app_event_manager: CLOUD_EVT_DATA_SEND_QOS
    %CESQ: 65,3,18,2
    %MDMEV: SEARCH STATUS 2
    +CSCON: 1
    %CESQ: 67,3,23,3
    +CSCON: 0
    %CESQ: 255,0,255,0
    

Reply
  • Hi,
        Thank you for your help. After following your instructions asset tracking code is producing log outputs without any issue.

    *** Booting nRF Connect SDK d96769faceca ***
    Attempting to boot slot 0.
    Attempting to boot from address 0x8200.
    Verifying signature against key 0.
    Hash: 0xb0...7c
    Firmware signature verified.
    Firmware version 1
    Setting monotonic counter (version: 1, slot: 0)
    *** Booting nRF Connect SDK d96769faceca ***
    *** Booting nRF Connect SDK d96769faceca ***
    [00:00:00.255,218] <inf> app_event_manager: APP_EVT_START
    [00:00:00.492,187] <inf> nrf_modem_lib_trace: Trace thread ready
    [00:00:00.499,816] <inf> nrf_modem_lib_trace: Trace level override: 2
    [00:00:00.500,061] <inf> app_event_manager: MODEM_EVT_INITIALIZED
    [00:00:00.572,937] <inf> app_event_manager: MODEM_EVT_LTE_CONNECTING
    [00:00:01.291,320] <inf> app_event_manager: DATA_EVT_CONFIG_INIT
    %CESQ: 65,3,18,2
    +CEREG: 2,"4006","034A1710",7
    [00:00:01.832,885] <inf> app_event_manager: MODEM_EVT_LTE_CELL_UPDATE
    +CSCON: 1
    %CESQ: 67,3,23,3
    +CGEV: ME PDN ACT 0,0
    [00:00:03.045,684] <inf> app_event_manager: MODEM_EVT_LTE_CONNECTED
    [00:00:03.047,149] <inf> app_event_manager: CLOUD_EVT_CONNECTING
    +CNEC_ESM: 50,0
    %MDMEV: SEARCH STATUS 2
    +CEREG: 1,"4006","034A1710",7,,,"00001010","11000001"
    [00:00:03.051,910] <inf> app_event_manager: MODEM_EVT_LTE_PSM_UPDATE
    %XTIME: "0A","4240511143610A","01"
    [00:00:03.071,441] <inf> app_event_manager: DATA_EVT_DATE_TIME_OBTAINED
    [00:00:06.409,057] <inf> app_event_manager: CLOUD_EVT_CONFIG_RECEIVED
    [00:00:06.413,360] <inf> app_event_manager: DATA_EVT_CONFIG_SEND
    [00:00:06.414,337] <inf> app_event_manager: CLOUD_EVT_DATA_SEND_QOS
    [00:00:07.137,115] <inf> app_event_manager: CLOUD_EVT_CONNECTED
    [00:00:07.138,488] <inf> app_event_manager: APP_EVT_DATA_GET - Requested data types (MOD_DYN, MOD_STAT, BAT, ENV, LOCATION)
    [00:00:07.139,282] <inf> app_event_manager: LOCATION_MODULE_EVT_ACTIVE
    [00:00:07.141,113] <inf> app_event_manager: SENSOR_EVT_ENVIRONMENTAL_NOT_SUPPORTED
    [00:00:07.142,120] <inf> app_event_manager: SENSOR_EVT_FUEL_GAUGE_NOT_SUPPORTED
    [00:00:07.142,791] <inf> app_event_manager: LOCATION_MODULE_EVT_AGNSS_NEEDED
    [00:00:07.210,906] <inf> app_event_manager: MODEM_EVT_MODEM_STATIC_DATA_READY
    [00:00:07.325,744] <inf> app_event_manager: MODEM_EVT_MODEM_DYNAMIC_DATA_READY
    +CSCON: 0
    %CESQ: 255,0,255,0
    [00:01:41.825,103] <wrn> location: GNSS timed out possibly due to too short GNSS time windows
    %CESQ: 64,3,18,2
    %CESQ: 68,3,23,3
    %NCELLMEAS: 0,"034A1710","310410","4006",65535,5110,49,70,28,101853,0
    %NCELLMEAS: 0,"034A1710","310410","4006",65535,0,5110,49,70,27,102030,0,0,"0052A40C","310260","A2E3",65535,0,1026,22,36,22,102039,0,0
    %NCELLMEAS: 0,"034A1710","310410","4006",65535,0,5110,49,70,28,104004,0,0,"0052A40C","310260","A2E3",65535,0,1026,22,36,24,104013,0,0,"02982901","311580","1101",65535,0,5035,354,60,21,104022,0,0,"0328CB03","311480","CF03",65535,0,5230,146,54,23,104079,0,0
    [00:01:44.540,679] <inf> app_event_manager: LOCATION_MODULE_EVT_CLOUD_LOCATION_DATA_READY
    [00:01:44.541,351] <inf> app_event_manager: DATA_EVT_DATA_READY
    [00:01:44.552,551] <inf> app_event_manager: DATA_EVT_CLOUD_LOCATION_DATA_SEND
    [00:01:44.556,884] <inf> app_event_manager: DATA_EVT_DATA_SEND_BATCH
    [00:01:44.557,739] <inf> app_event_manager: CLOUD_EVT_DATA_SEND_QOS
    [00:01:44.557,983] <inf> app_event_manager: CLOUD_EVT_CLOUD_LOCATION_UNKNOWN
    [00:01:44.558,685] <inf> app_event_manager: LOCATION_MODULE_EVT_INACTIVE
    [00:01:44.559,906] <inf> app_event_manager: CLOUD_EVT_DATA_SEND_QOS
    %CESQ: 65,3,18,2
    %MDMEV: SEARCH STATUS 2
    +CSCON: 1
    %CESQ: 67,3,23,3
    +CSCON: 0
    %CESQ: 255,0,255,0
    

Children
Related