
Hi,
I'm using VSCode to develop firmware for the nRF5340 microcontroller using Zephyr OS.
I use EVK-NORA-B106 development board, I use nRF Connect SDK v2.6.0 and my operating system is windows.
My problem is that I can't get the core network to work.
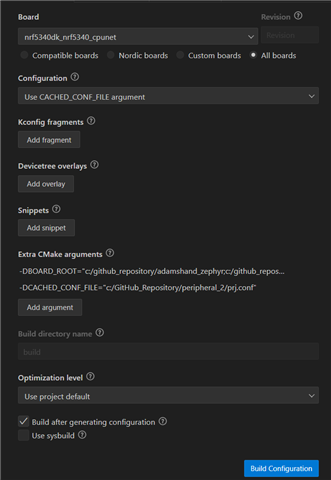
I created a new application and copied the peripheral sample (C:\ncs\v2.6.0\zephyr\samples\bluetooth\peripheral).
I selected nrf5340dk_nrf5340_cpunet as the board
Compilation of the code is successful without errors.
[216/216] Linking C executable zephyr\zephyr.elf
Memory region         Used Size  Region Size  %age Used
           FLASH:      210932 B       256 KB     80.46%
             RAM:       32261 B        64 KB     49.23%
           SRAM1:          0 GB        64 KB      0.00%
        IDT_LIST:          0 GB        32 KB      0.00%
Even writing to the flash is successful...
-- west flash: using runner nrfjprog
-- runners.nrfjprog: mass erase requested
-- runners.nrfjprog: reset after flashing requested
-- runners.nrfjprog: Flashing file: c:\GitHub_Repository\peripheral_2\build\zephyr\zephyr.hex
[ #################### ]   0.294s | Erase file - Done erasing
[ #################### ]   1.460s | Program file - Done programming
[ #################### ]   1.481s | Verify file - Done verifying
Applying pin reset.
-- runners.nrfjprog: Board with serial number 960157638 flashed successfully.
even if the following message sometimes appears:
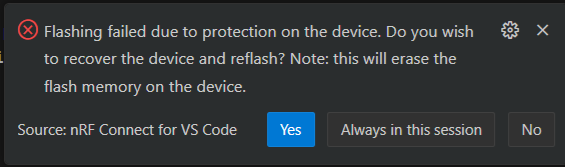
Unfortunately, however, the application does not work. I should see a BLE device with the name "Zephyr Peripheral Sample Long Name" but nothing.
If I try to start debugging this is what I see on the terminal:
JLinkGDBServerCL: SEGGER J-Link GDB Server V7.94e Command Line Version
JLinkGDBServerCL:
JLinkGDBServerCL: JLinkARM.dll V7.94e (DLL compiled Jan 15 2024 15:18:46)
JLinkGDBServerCL:
JLinkGDBServerCL: -----GDB Server start settings-----
JLinkGDBServerCL: GDBInit file:                  none
JLinkGDBServerCL: GDB Server Listening port:     59052
JLinkGDBServerCL: SWO raw output listening port: 2332
JLinkGDBServerCL: Terminal I/O port:             2333
JLinkGDBServerCL: Accept remote connection:      localhost only
JLinkGDBServerCL: Generate logfile:              off
JLinkGDBServerCL: Verify download:               off
JLinkGDBServerCL: Init regs on start:            off
JLinkGDBServerCL: Silent mode:                   on
JLinkGDBServerCL: Single run mode:               on
JLinkGDBServerCL: Target connection timeout:     0 ms
JLinkGDBServerCL: ------J-Link related settings------
JLinkGDBServerCL: J-Link Host interface:         USB
JLinkGDBServerCL: J-Link script:                 none
JLinkGDBServerCL: J-Link settings file:          none
JLinkGDBServerCL: ------Target related settings------
JLinkGDBServerCL: Target device:                 nrf5340_xxaa_net
JLinkGDBServerCL: Target device parameters:      none
JLinkGDBServerCL: Target interface:              SWD
JLinkGDBServerCL: Target interface speed:        12000kHz
JLinkGDBServerCL: Target endian:                 little
JLinkGDBServerCL:
=thread-group-added,id="i1"
=cmd-param-changed,param="pagination",value="off"
0x010173b2 in sym_PHK7RXLFFTGYQNCW3IEEUVLOAYXWQJQYEN3DT7Y ()
The strange thing is that the debug starts by itself, if I press the pause button (F6) the code stops on the following line of the mpls_init.c file:
err = mpsl_init(&clock_cfg, CONFIG_MPSL_LOW_PRIO_IRQN, m_assert_handler);
If I press the continue button (F5) the code remains stuck on that line of code and does not continue.
Can someone help me?
Thank you.

