CONFIG_DEBUG_OPTIMIZATIONS does not allow setting breakpoints anywhere

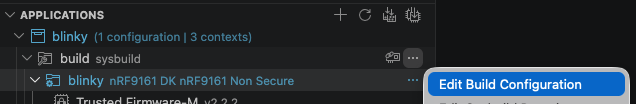
When debugging the exercise 1 application from `Lesson 2 – Reading buttons and controlling LEDs` of `nRF Connect SDK Fundamentals`, I cannot set a breakpoint wherever I want.

Somehow it is either not picked up or it gets picked the line below.

However, if I debug step by step from the beginning, it can stop on all lines.
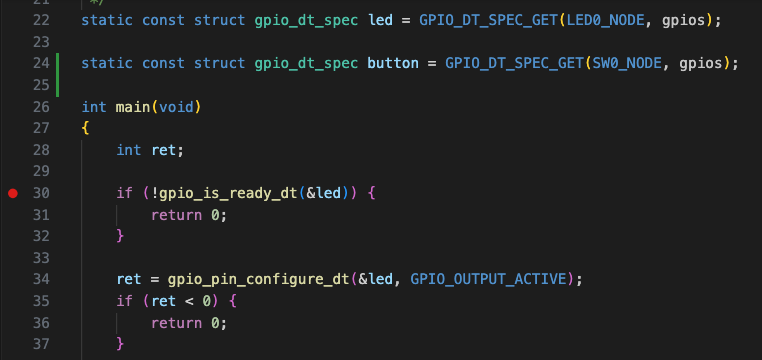
In this code:

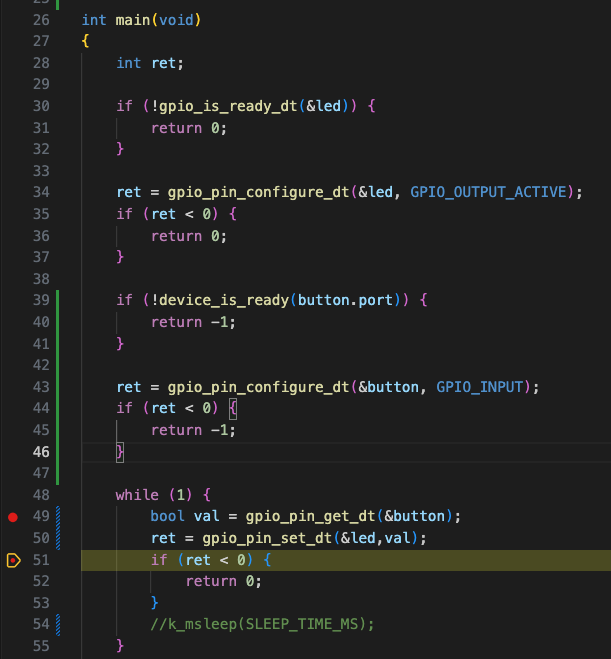
The 2 lines below get ignored, I cannot break on them:

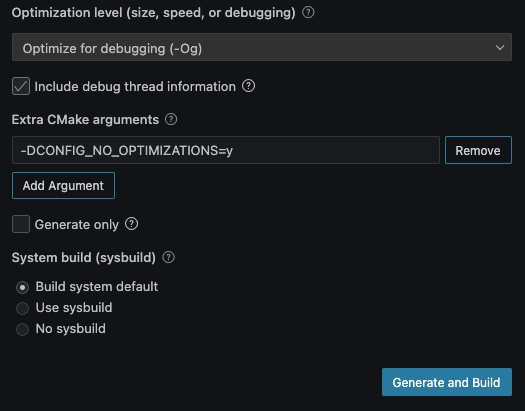
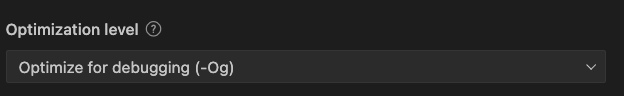
I am setting CONFIG_DEBUG_OPTIMIZATIONS by selecting:

However, it seems not sufficient as there are probably some optimisations that are made on the code.

I remember when debugging on nRF52, I had to set:

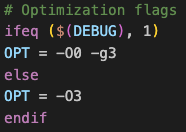
so `-O0 -g3` flags in order to propely debug and I think I need to also enable `CONFIG_NO_OPTIMIZATIONS` but I can't override its value together with `CONFIG_DEBUG_OPTIMIZATIONS`.

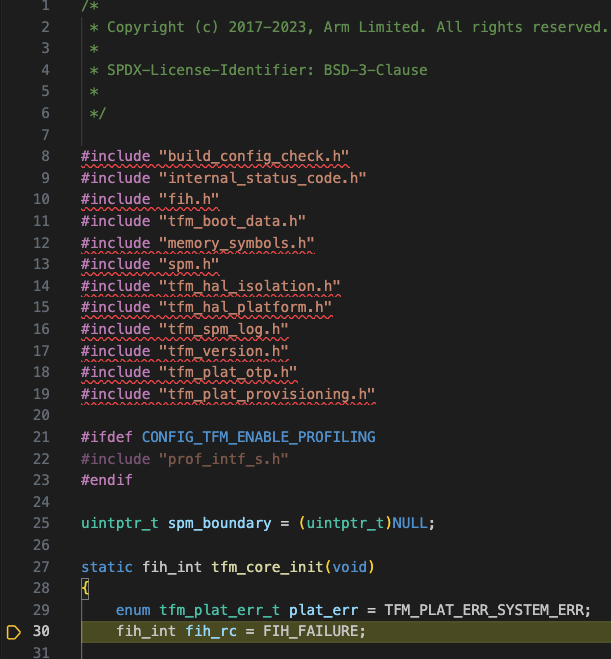
Another issue I see is if I put a breakpoint here just before starting to debug:

I get the debugger to stop here:

Any hints?

  • Hi,

    Apologies for the delay. I was able to replicate it here. I am discussing this with experts in order to find a solution and will keep you updated.

    -Priyanka

  • This should be solvable by disabling optimizations.

    If you are using the nRF Connect for VSCode extension, edit the build configuration:

    and set it to debug mode, but also add the CMake arg here:
    -DCONFIG_NO_OPTIMIZATIONS=y

    and click the blue button (important!).

    As for why the debugger is stopping you in the TFM file, it is because that file's debug info (build/blinky/tfm/bin/tfm_s.elf) is being added as an extra symbol-file to GDB, in addition to zephyr.elf, and this file is also named main.c .

    If you keep clicking Continue (F5) on the debugger, you should eventually hit the actual src/main.c file you want.

    I will investigate if that can be improved

    Best regards,

    Kristian from the nRF Connect for VSCode developer team

Related