Direction finding: PI shift in phase difference for 2M PHY

Hi!

I am using v2.6.1/nrf/samples/bluetoothdirection_finding_connectionless_tx/rx sample, and NCS v2.6.1 for AoA. I made some modification on the rx side to stream I/Q data via serial port, and read and calculate AoA on Ubuntu using a python script.

RX board: nrf5340 devkit + antenna

TX board: nrf5340/nrf52833 devkit

Antenna: 2 patterns with a distance of 5.3 cm (ant0: reference ant, ant1: sample ant), with settling time after switching within 100~250ns

Problem Description:

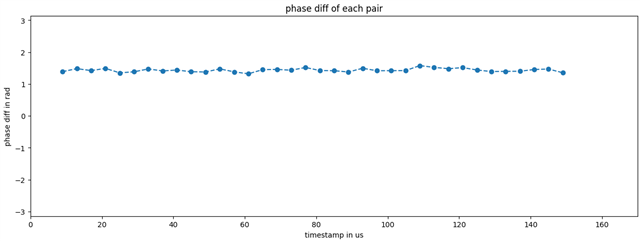
Right now the angle calculation works well if tx uses 1M PHY. But if I switch it to 2M, it will get wrong results. After looking into the phase data, I find a 180 degree shift for every calculated phase difference, so I manually eliminate that shift and then 2M works. I wonder if anyone has met the same problem and what could cause that, any thoughts will be appreciated!

About CTE configuration:

I am using 1 us sample slot for both 1M and 2M

TSAMPLESPACINGREF = 1us

TSAMPLESPACING = 2us

TSWITCHSPACING = 2us

Details of Calculation:

I have read the white paper nWP-036 and understand the antennas are going to be switched in order [0,0,0,0,0,0,0,0] (8 for ref period) followed by [1, 0, 1, 0, ...](sample period). Besides the reference period, I am also using the sample period for calibration since ant0 will be visited again during the sample period.

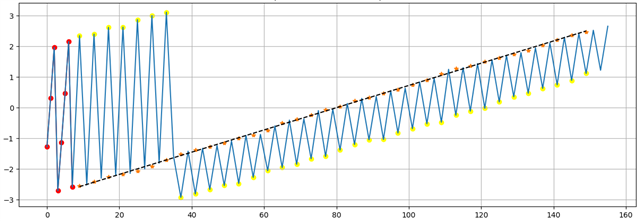
Here the figure (x-axis: time in us; y-axis: phase in rad) shows how I calculate the phase diff and AoA for a 160us CTE report when using 1M PHY. The red dots are phases of each I/Q data from ant0 during the reference period; and the dots marked as orange stars are the calibrated reference phases, which are prepared for phase difference calculation for each sample from ant1 (yellow dots); calculated phase diff will be shifted by N*2pi to make sure it is within range [-pi, pi]; finally calculated AoA using the arccos formula as the white paper does.

Note that the first sample during the ref period is aligned with time=0, and the first sample during the sample period (first yellow dot) is aligned with time=9 (equals to time of the last ref sample(7us) + TSAMPLESPACINGREF + TSWITCHSPACING/2, according to nWP-036), please correct me if I made any mistake.

If using 2M PHY, the calculation should be the same as 1M theoretically, except the wavelength for calculating AoA will be different. But it turns out calculated phase diff with 2M PHY always gives a 180 degree shift.

  • Hi

    Note that to get good Direction Finding values we strongly recommend that you use at least a 2x2 antenna array for better Direction Finding results.

    Could it be that since the 1µs sample slot timing is targeted for the 2Mbps PHY, and the 2µs sample slot timing is targeted for the 1Mbps PHY. Have you taken this into account when printing out the data as well?

    We strongly recommend transforming the raw data into phase/amplitude as well, as the frequency will never be 500kHz, and the phase shift shouldn't be a full 180 degree inside the reference period. 

    Can you share some details of how you're extracting and printing the IQ data in your application? Since it's not transformed from raw IQ data to phase/amplitude we can't guarantee that this is evaluated correctly. More on transforming raw IQ data here. The issue is that all parameters may make I&Q data look like they're drifting even when rock solid, and we are currently leaning towards the data not being extracted correctly and that you're missing a sample here.

    Best regards,

    Simon

  • Hi Simonr,

    Note that to get good Direction Finding values we strongly recommend that you use at least a 2x2 antenna array for better Direction Finding results.

    Thanks for you suggestion! I agree with that, here in this post I only show the results from 2 patterns in order to make the question clear. More antennas will be used in actual development.

    Could it be that since the 1µs sample slot timing is targeted for the 2Mbps PHY, and the 2µs sample slot timing is targeted for the 1Mbps PHY. Have you taken this into account when printing out the data as well?

    In this post, the rx side is using 1us slot for both 1M/2M PHY, it is to make the timestamp of each sample consistent when comparing the behavior. I do have script for 2us slot, in which there will be some difference in timestamp alignment for samples and frequency shifting calibration. That was also tested, and still a PI shift was observed only in 2M PHY.

    We strongly recommend transforming the raw data into phase/amplitude as well, as the frequency will never be 500kHz, and the phase shift shouldn't be a full 180 degree inside the reference period. 

    Yeah, the raw I/Q data was streamed via USB serial port to Ubuntu, and a python script is implemented for handling data converting, aoa calculating and visualization. I and Q will first be combined into a complex number and then phase angle is calculated using nump.angle. The figure in post shows the converted phase value (y-asix) in radians. We don't take amplitude since it won't be used in aoa calculation.

    I understand the frequency will be 250k/500k for 1M/2M respectively with some offset. As suggested here, I am using samples from ant0 during the sample duration, to calibrate the frequency got from reference duration.

    The full 180 degree phase shift I mentioned is not something related to that drifting or offset to 250k/500k, there might be some misunderstanding so please let me explain it.

    As you can see in the plot of post, the red dots represent the samples inside the reference period, and it shows an undersampled sine wave of two periods, with a several-degrees phase shift/drift, which is quite normal.

    The 180 degree phase diff shift, that I am asking about in this post, is observed after calculating phase difference for each pair of yellow dot and orange star. There is 180 degree shift for every pair.

    To be more clear, for example if calculating phase difference and aoa of the first yellow dot (Y1) and the first orange star (O1) in plot, it is 

    • phase_diff = phase_value_Y1 - phase_value_O1
    • aoa = arccos(phase_diff * wavelength / (2 * PI * pattern_distance))

    If assuming the tx is on the centre line of the two ant patterns of rx,

    • phase_diff should be 0, and then
    • aoa = arccos(0) = PI/2

    In 1M, the actual calculating is exactly like this. However if using 2M, "phase_diff = PI" is what I get.

    and we are currently leaning towards the data not being extracted correctly and that you're missing a sample here.

    If you count number of yellow dots, it is 37 plus the last down-facing spike which I didn't mark it out, which are from ant1 inside sample duration, there are 37 samples from ant0 inside the sample duration which are the rest of spikes without marks.

    That is 37+37=74 samples. Plus 8 samples inside reference duration, it is 82 samples in total as stated in white paper. I don't think I missed any sample here. It might look in that way because the 4us guard duration doesn't show up in plot. BTW, a missing sample shouldn't cause 180 degree shift inside phase diff calculation for each pair.

  • The red dots should be at 0 degrees if your frequency compensation is working so the fact you have a drift seems to indicate your frequency compensation is not good enough. You should always use the extracted frequency from the reference period and never use 250/500KHz, they should only show you the ballpark.

    Since there are more moving elements between 1 and 2MHz I don't believe trying to compare these with the same sampling has any value, use the settings that will be used in real applications instead.

  • You should always use the extracted frequency from the reference period and never use 250/500KHz, they should only show you the ballpark.

    I understand the extracted freq would be 250/500KHz + some offset. That is why I used both red dots in reference period and samples from ant0 in sample period to calibrate that frequency.

    The red and yellow dots in post are phase angle of raw I/Q data, of course you can see a drift there. That drift will be eliminated after getting the difference between yellow dots and orange stars, in this step:

    To be more clear, for example if calculating phase difference and aoa of the first yellow dot (Y1) and the first orange star (O1) in plot, it is 

    • phase_diff = phase_value_Y1 - phase_value_O1
    • aoa = arccos(phase_diff * wavelength / (2 * PI * pattern_distance))

    If plot the phase_diff as below, there is no drift, only some noise. It can also be observed by just looking at the trend of yellow dots and orange stars.

    Since there are more moving elements between 1 and 2MHz I don't believe trying to compare these with the same sampling has any value, use the settings that will be used in real applications instead.

    This post isn't to compare the 1M/2M PHY from the same sampling value. Sorry if it is confusing, I only showed one set of samples with tx running on 1M PHY, and it is just for explaining how I calculate phase diff and AoA using raw data. 2M results was sampled with tx running on 2M BLE PHY in test.

    My point is by following the same calculation method, there will be a PI shift.

    For example, the phase diff is about 1.4 rad under 1M PHY, and then apply the arccos formula you will get correct AoA. But if run sampling using 2M tx again with physical position unchanged, the phase diff you get will be something around -1.74 rad (that is 1.4-PI), and that will lead to wrong AoA result.

    I am asking why there is such a shift, and if there is a mistake in my calculation, please correct me and explain why I can get the correct results for 1M PHY with wrong method. I believe I am exactly following the steps given by white paper.

  • Hi Yue

    Isn't this shift you're seeing when changing the data rate from 1Mbps to 2Mbps that the frequency offset changes from 250kHz to 500kHz? Please explain if that's not itm but that seems to make sense if you ask me: https://infocenter.nordicsemi.com/index.jsp?topic=%2Fnwp_036%2FWP%2Fnwp_036%2Ffrequency_offset.html 

    Best regards,

    Simon

Related