Direction finding: chan_idx of CTE sent in single periodic advertising train

Hi!

I am using direction_finding_connectionless_tx/rx sample, and NCS v2.6.1 for AoA.

RX board: nrf5340 devkit + antenna

TX board: nrf5340/nrf52833 devkit

Problem Description:

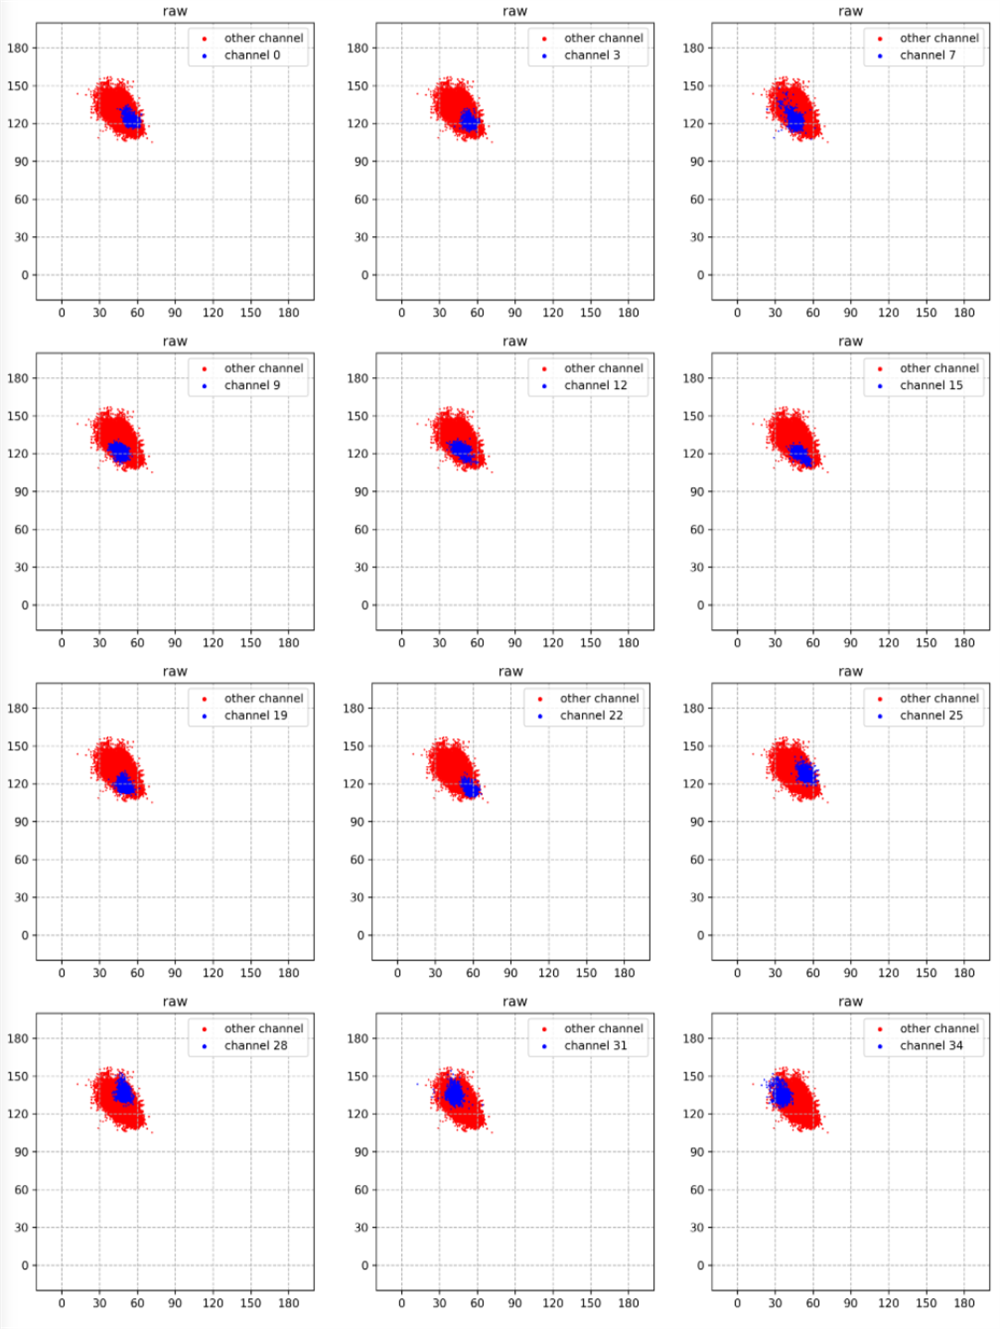
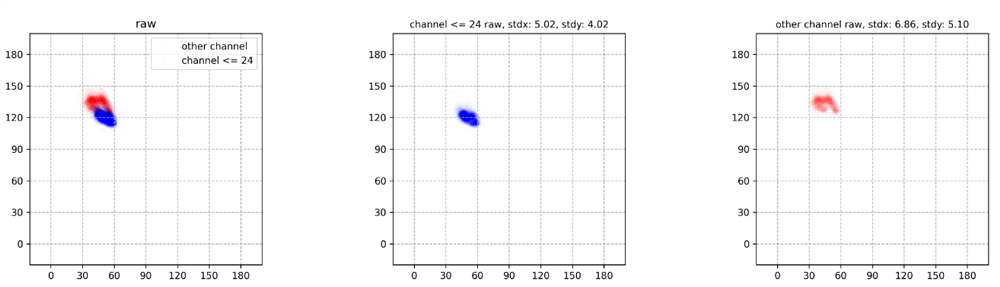
I notice that within each periodic advertising, it contains 5 CTE reports, and channel id of which are N(a random number) followed by 0,0,0,0. And after calculating AoA for each report, I find that the reports with chan_idx=0 are close to each other, however the one that is not 0 has a great bias comparing to the 0 ones.

I wonder if the random channel selecting is actually working or not, because it sounds odd to me that CTE reports within a single periodic advertising train have different BLE channel id.

Configurations:

tx side: #define PER_ADV_EVENT_CTE_COUNT 5

rx side: bt_df_per_adv_sync_cte_rx_param.max_cte_count = 0 (receive continuously)

Parents Reply Children
  • Hello again,

    Thanks for the help identifying one of the issues here, as well your patience with this case. I have had this case a bit on hold since I assumed I would need help from the team to move on here.

    Regarding what you said here in the github issue about the new plots, are you necessarily seeing that the offsets are higher chan_idx? Could you expand a bit on how you are seeing it? I am not sure if I am seeing that myself.

    Regards,

    Elfving

  • Here are the plots I posted in the github issue:

    You can see from plots above with chan_idx <= 22, the dots (blue) gather around the (x,y) = (50,120), as chan_idx goes higher than 22, the dots (blue) start to move up and to the left corner of the overall spreading (red)

    Additionally, in the plots below, I

    • adjust the transparency of the dots
    • mark samples from chan_idx <= 24 as blue
    • mark samples from chan_idx > 24 as red

    to better show where most dots locate, and make it easier to see the difference.

    It is easy to tell that the samples from chan_idx <= 24 gather around (x,y)=(50,120), while the samples from chan_id>24 gather around somewhere else at (45, 135).

    Moreover, if you look at the standard deviation values for x and y shown as tittle (xstd and ystd), samples from chan_id<=24 have tighter spreading, even though they come from more channels comparing to the other party.

  • Hmm yeah, you've convinced me that there is something wrong here. 

    Could you show me how you are calculating the referance for this?

    And could you show me the phase data, with the calculated reference in the same graph, and the corresponding phase shift?

    Regards,

    Elfving

  • Hi Elfving,

    Could you show me how you are calculating the referance for this?

    You may refer to this post for my calculation, I am using 2M PHY and TSAMPLESPACING = 2us for this data set. Although that post is for one-dimensional calculation, two-dimensional calculation is just similar thing.

    And could you show me the phase data, with the calculated reference in the same graph, and the corresponding phase shift?

    You can find those data in debug_output.txt attached, and here is an example of first chunk of data in it:

    Json msg: {'chid': 26, 'phy': 2, 'tss': 2, 'iq': [-11, 26, 12, -28, -14, 26, 13, -27, -15, 27, 18, -25, -21, 21, 15, -20, 31, 19, -24, 20, 5, 22, 25, -13, 20, 33, -29, 10, -6, 21, 26, -2, 8, 35, -30, -4, -16, 19, 24, 11, -11, 33, -26, -18, -22, 10, 17, 21, -20, 30, -16, -27, -23, 0, 9, 26, -33, 13, -1, -31, -22, -11, -5, 26, -35, -2, 10, -28, -12, -18, -17, 21, -33, -14, 23, -20, -6, -22, -24, 14, -24, -27, 28, -11, 7, -23, -29, 0, -14, -34, 30, 5, 14, -19, -25, -11, 7, -37, 26, 17, 21, -12, -22, -16, 20, -28, 14, 28, 24, -1, -10, -29, 31, -17, 4, 32, 21, 9, 4, -24, 35, -2, -11, 29, 16, 17, 15, -21, 33, 15, -19, 24, 6, 24, 24, -19, 24, 23, -26, 12, -5, 23, 29, -4, 9, 36, -30, -1, -13, 19, 27, 6, -8, 35, -27, -18, -20, 11, 22, 15, -20, 30, -20, -26]}
    Raw phases  : [1.9710369838288708, -1.1659045405098132, 2.0647376957144776, -1.1220729827841756, 2.0778948311872334, -0.9467732738181398, 2.356194490192345, -0.9272952180016122, 0.549853182676585, 2.44685437739309, 1.3473197256542635, -0.4795192919925962, 1.025932411343353, 2.8095331860469077, 1.849095985800008, -0.07677189126977804, 1.346085158380254, -3.0090411212931194, 2.2706891965141405, 0.4297622790966885, 1.892546881191539, -2.5360479899848234, 2.714965160462917, 0.8902751021276822, 2.158798930342464, -2.105751400580993, 3.141592653589793, 1.237552025683224, 2.766321830733836, -1.6030432092301505, -2.677945044588987, 1.7607846147136124, -3.0845118711835284, -1.2277723863741932, -2.158798930342464, 2.251317551462111, -2.7403638545849445, -0.7157435896688801, -1.837048375945822, 2.6135182051634334, -2.297438667476622, -0.3743336160075839, -1.2753554896511765, 3.141592653589793, -1.9614033704925835, 0.16514867741462683, -0.9357695914045828, -2.7270857790050074, -1.3838170568759856, 0.5790742693677309, -0.5191461142465229, -2.5127963671743605, -0.9505468408120752, 1.1071487177940904, -0.04164257909858842, -1.9028557943377822, -0.5016040541891205, 1.446441332248135, 0.40489178628508343, -1.4056476493802699, -0.0570807824062646, 1.9333405640594041, 0.8156919233162234, -0.9505468408120752, 0.4266274931268761, 2.2404352724715344, 1.3258176636680326, -0.6696389456766376, 0.7641247773733871, 2.7091848780192556, 1.784857010358718, -0.13706617431018764, 1.3258176636680326, -3.108271657711546, 2.17084654019665, 0.21866894587394195, 1.7955074952095393, -2.5535900500422257, 2.6387494426619322, 0.5984188934785372, 2.158798930342464, -2.2264919530364327]
    Reference  x: [[9, -0.8153512364993581], [17, -0.3788324418118917], [25, 0.0498616513218386], [33, 0.5448904848544369], [41, 0.9770943330165677], [49, 1.368360172940821], [57, 1.883417848900737], [65, 2.3418677148874414], [73, 2.745536817270023], [81, 3.2452193722359897], [89, 3.6096718811322406], [97, 3.9228740832143703], [105, 4.504631549081182], [113, 4.991312859941365], [121, 5.402865440151371], [129, 5.746689554344561], [137, 6.235052912915432]]
    Phase diff x: [1.77638823441385, 1.7368278004345483, 1.8453691465313777, 1.7939362572526911, 1.959888056263897, 1.7436309957967782, 1.8263370664944727, 1.9406389158825927, 1.9013828311568517, 2.06503008913878, 1.8518962844184337, 1.7318282704366528, 1.8646429496805084, 1.906800988757837, 1.8346452934347006, 1.8409721233813805, 1.7676425956576054]
    Reference  y: [[13, 2.537524079556545], [21, 2.9256859360067975], [29, 3.392392468713541], [37, 3.85471146454572], [45, 4.3031109544363035], [53, 4.773959803663425], [61, 5.183420119981721], [69, 5.6527942109260305], [77, 6.043722264527555], [85, 6.551815382582489], [93, 6.994278188653907], [101, 7.475157178587188], [109, 7.851351447380539], [117, 8.293299548342024], [125, 8.640807981038051], [133, 9.108802378061037], [141, 9.596769358564957]]
    Phase diff y: [-1.9513882996875118, -2.065002703383003, -2.019889381390392, -2.00184634950699, -1.9800743527432827, -1.972873112516968, -2.0825589104451936, -1.9349353738975275, -2.1057002065906474, -1.937192986782307, -1.9113536578689505, -1.9079782030836032, -1.9783182996739228, -1.9471703357435786, -2.109787643399361, -2.100832593067061, -1.998855142401073]

    • "Json msg" contains channel index, PHY, TSAMPLESPACING, and raw IQ data from bt_df_per_adv_sync_iq_samples_report in Json format, note that IQ samples are in format like [I0, Q0, I1, Q1, ..., In, Qn].
    • "Raw phases" are phase angles calculated directly from IQ sample
    • "Reference  x " are calculated reference for x-axis, the data are in format [timestamp, phase], timestamp stands for with which sample data it is going to be used for calculating the phase difference, for example, phase angle sampled from antenna on x-axis at timestamp t=9us, will be subtracted with reference [9, xxx] in "Reference x"
    • "Phase diff x" are the result from the subtraction above and will be used for calculating AoA for x-axis
    • "Reference  y " and "Phase diff y" are similar things as above

    For more detailed explanation, please refer the the post I mention above.

    debug_output.txt

Related