Pointers on how to debug nRF9160 soft reset

Hi,

I'm developing an application on the nRF9160DK with custom firmware for both the nRF52840 as well as the nRF9160 on the board, using VSCode with the nRF Connect extension. (I'm currently on ncs v2.5.0 in case that matters.) Development is mostly going well, but I recently started running into the nRF9160 soft resetting (reset reason: 65536) which I'm not sure how to debug since there is nothing being logged which could point me to what is going wrong. Could you provide me with any pointers on how to go about debugging soft resets of the nRF9160?

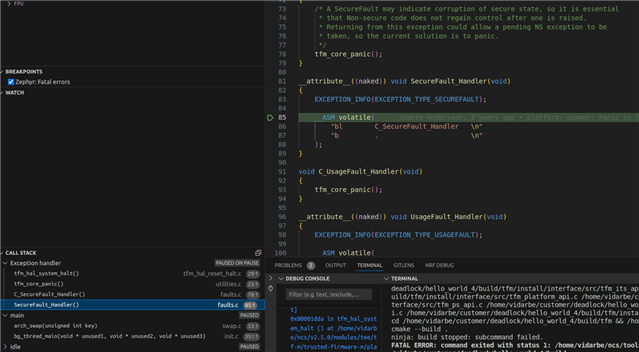
With hard faults I could set the debugger to set a breakpoint whenever a "Zephyr: Fatal error" occurs, but this is not the case here since it's only a soft reset and not a hard fault. Is there a way to generate hard faults whenever a soft reset happens?

Best,

Wout

Parents Reply Children
  • Hi Vidar,

    Thank you for your feedback. I tried setting the breakpoint both in NVIC_SystemReset() and in sys_arch_reboot() (in scb.c), but the code doesn't seem to hit either of these lines as it's not breaking there.

    I checked my .config file in my build folder and CONFIG_RESET_ON_FATAL_ERROR is set to "y".

    I just had another encounter (different from the one that made me open this ticket) and I found that the issue was that I was (re)scheduling a delayable work that I forgot to initialize first. I'm not sure if this would 'normally' (when not using tfm) result in a hard fault or anything that should leave a trace to help with debugging this?

  • Hi,

    Good catch. I think in v2.6.0 and later, a secure fault in the TF-M will be forwarded to the fatal error handler in the main app. Thus, making it easier to catch secure faults. The CONFIG_RESET_ON_FATAL_ERROR setting is also applied to the error handling in the TF-M image.

    WoutWG said:
    I just had another encounter (different from the one that made me open this ticket) and I found that the issue was that I was (re)scheduling a delayable work that I forgot to initialize first. I'm not sure if this would 'normally' (when not using tfm) result in a hard fault or anything that should leave a trace to help with debugging this?

    I assume this lead to a secure fault. This can happen if the app tries to access secure RAM. For instance, when dereferencing a NULL pointer.

  • Hi Vidar,

    That's very helpful. I'll consider upgrading to v2.6.0, but in the meantime, is there a way to debug secure faults while on v2.5.0? 

    Searching the sdk files, I found a reference to a 'secure_fault' function in zephyr>arch>arm>core>aarch32>cortex_m>fault.c, but it is only enabled when CONFIG_ARM_SECURE_FIRMWARE is defined which isn't the case for my application (it's not even mentioned in .config in my build output, not even commented out), so it seems that this is not the error handler that I'm after.

  • Hi,

    The secure fault handler is implemented in the TF-M application, not in the main application. But you can start a debug session with the main app and inspect the call stack after the secure fault has been raised.

    e.g., dereferencing NULL pointer to trigger a secure fault:

  • Hi Vidar,

    Thanks, but this doesn't work for me, I assume because I'm on v2.5.0. The only way I 'know' that this secure fault happens is because the application resets, so the only way I have to 'catch' the error is by setting a breakpoint at the start of main(). But at this stage, there is no more exception handler to inspect the call stack of.

    So far I have been able to identify errors more quickly now that I know what to look for. If it really starts becoming an issue again, I'll upgrade to v2.6.0+ to enable the fatal error handler which should provide more information as to where the error occurs. 

Related