Cannot debug BLE Fundamentals examples with VS Code and nRF54L15DK

Hi,

I am currently evaluating the new nRF54L15 DK development kit.

I installed VS Code v1.96.4 with nRF Connect for VS Code Extension Pack v2024.9.5. I am currently using SDK and toolchain v2.8.0 for my tests.

I was able to correctly download, compile and debug few example applications from the SDK like the 'blinky' app and the 'peripheral_lbs'.

Then I tried to do the same with examples provided in the BLE Fundamentals software pack (i.e bt-fund-main\v2.8.x-v2.7.0\l2\l2_e1_sol)

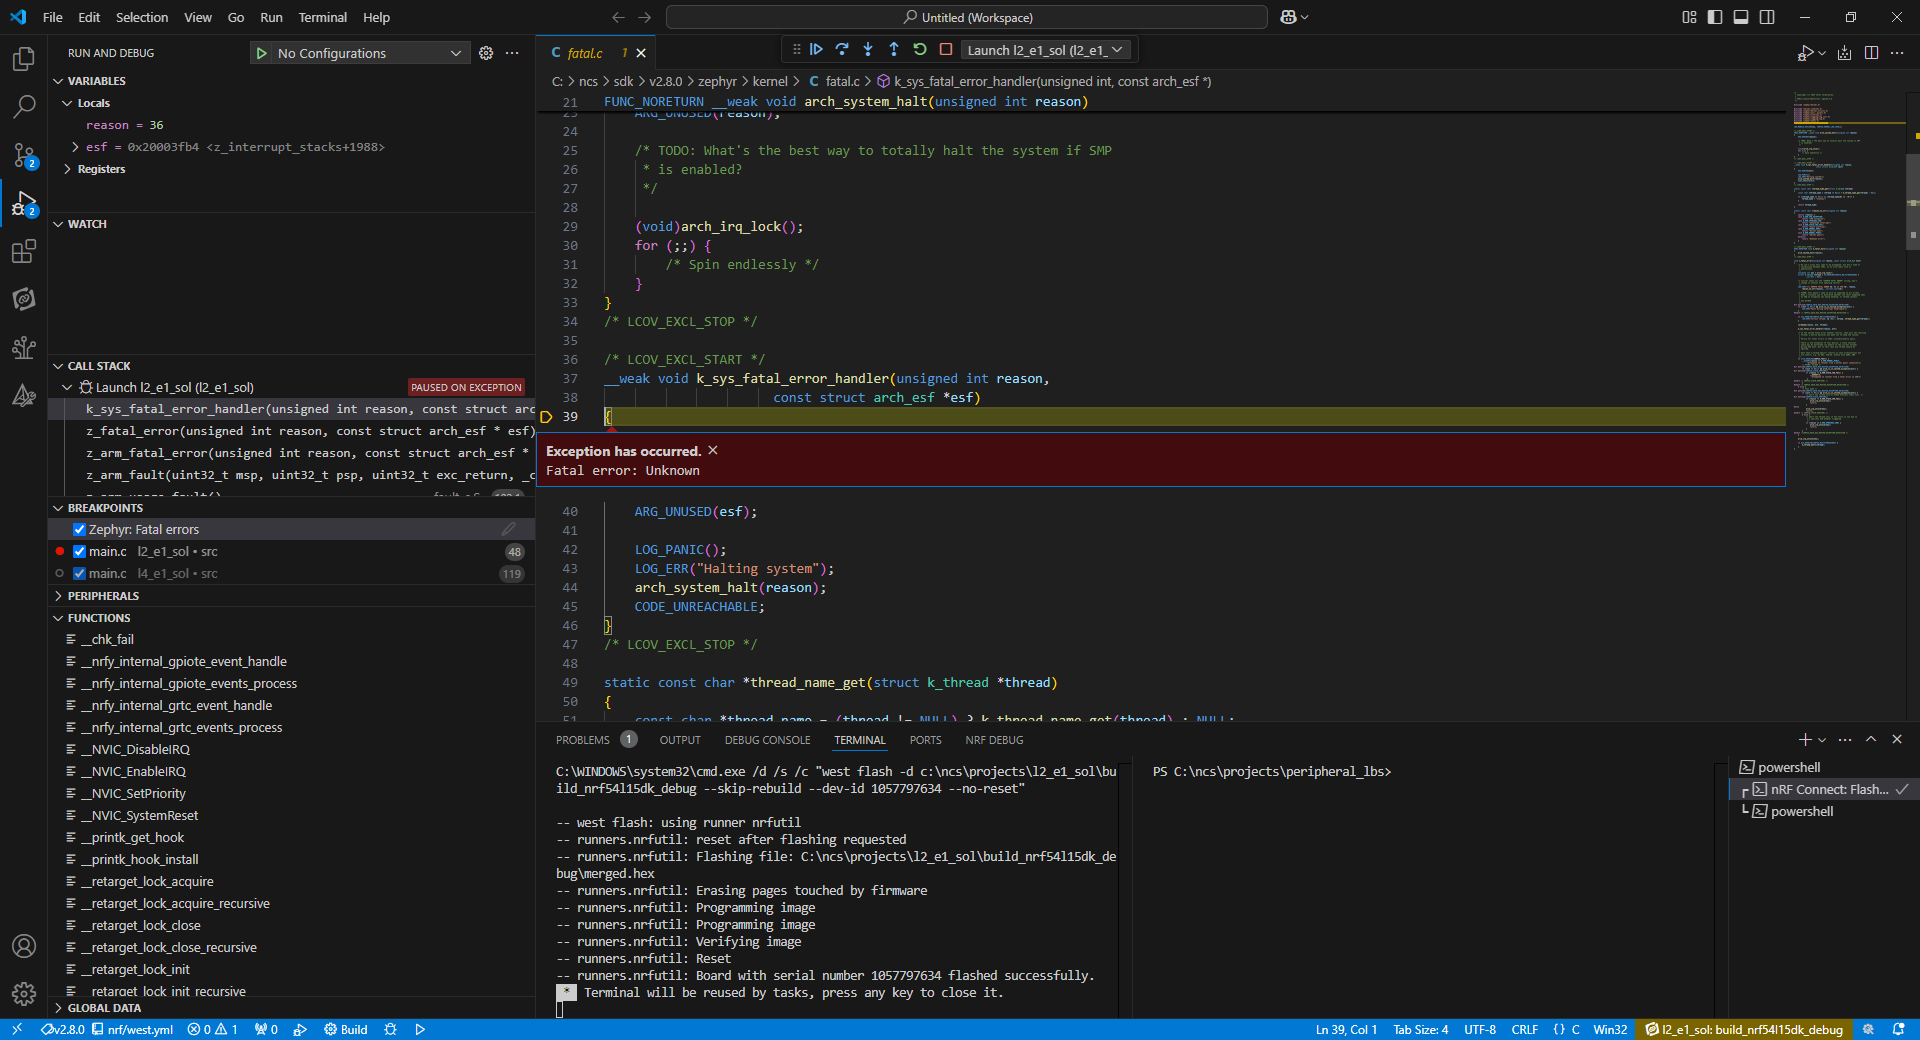
With 'l2_e1_sol' example app I am able to correctly compile and flash to the board (the code is executed like a charm); but when I try to start a debug session, an exception immediately occurs in Zephyr kernel and the debugger never jump into the main.

Is there any extra config to set to correctly debug the BLE Fundamentals example apps on nRF54L15 DK ?

Parents
  • Hi,

    A limitation when debugging BLE applications is that the Bluetooth stack may assert if you resume execution after halting the CPU (e.g., resuming execution after hitting a breakpoint). This happens because halting the CPU disrupts the real time requirements of the stack. However, this should not be an issue until BLE is enabled. Please make sure CONFIG_LOG=y is enabled in your project configuration (prj.conf) and check the debug log for runtime errors.

    Best regards,

    Vidar 

  • Hi Vidar,

    Thanks for the hints. CONFIG_LOG=y is enabled by default in the 'l2_e1_sol' example. Indeed, when I look into the log (refer to the print screen below) I realize that the debugger is executing the entire code. I don't know why it doesn't halt at the start of the main function or any breakpoints I place inside while it works with the 'blinky' app.

    This is quite strange since the same code can be correctly debugged on a nRF52840DK board.

    Gregory

  • Hi Gregory,

    Please try to continue execution (click the play button) and see if you get the crashlog from the error handler in the terminal. This should provide more information of what kind of fault it is and where it occurred.

    Vidar

  • Hi Vidar,

    I continued execution as you mentioned. Before, I set CONFIG_LOG_DEFAULT_LEVEL=4 to log a maximum of information.
    I copied below the DEBUG CONSOLE and TERMINAL outputs.
    On the play button press, no more information is logged in the TERMINAL. Concerning the DEBUG CONSOLE I highlighted in yellow the last information logged before continuing debug.
    Hope it will help to find the root cause.

    DEBUG CONSOLE

    JLinkGDBServerCL: SEGGER J-Link GDB Server V7.94i Command Line Version
    JLinkGDBServerCL:
    JLinkGDBServerCL: JLinkARM.dll V7.94i (DLL compiled Feb 7 2024 17:08:52)
    JLinkGDBServerCL:
    JLinkGDBServerCL: -----GDB Server start settings-----
    JLinkGDBServerCL: GDBInit file: none
    JLinkGDBServerCL: GDB Server Listening port: 51059
    JLinkGDBServerCL: SWO raw output listening port: 2332
    JLinkGDBServerCL: Terminal I/O port: 2333
    JLinkGDBServerCL: Accept remote connection: localhost only
    JLinkGDBServerCL: Generate logfile: off
    JLinkGDBServerCL: Verify download: off
    JLinkGDBServerCL: Init regs on start: off
    JLinkGDBServerCL: Silent mode: on
    JLinkGDBServerCL: Single run mode: on
    JLinkGDBServerCL: Target connection timeout: 0 ms
    JLinkGDBServerCL: ------J-Link related settings------
    JLinkGDBServerCL: J-Link Host interface: USB
    JLinkGDBServerCL: J-Link script: none
    JLinkGDBServerCL: J-Link settings file: none
    JLinkGDBServerCL: ------Target related settings------
    JLinkGDBServerCL: Target device: cortex-m33
    JLinkGDBServerCL: Target device parameters: none
    JLinkGDBServerCL: Target interface: SWD
    JLinkGDBServerCL: Target interface speed: 12000kHz
    JLinkGDBServerCL: Target endian: little
    JLinkGDBServerCL:
    =thread-group-added,id="i1"
    =cmd-param-changed,param="pagination",value="off"
    __enable_irq () at C:/ncs/sdk/v2.8.0/modules/hal/cmsis/CMSIS/Core/Include/cmsis_gcc.h:951
    951 __ASM volatile ("cpsie i" : : : "memory");
    [New Thread 536879424]
    [New Thread 536879224]
    [New Thread 536876840]
    [New Thread 536878992]
    [New Thread 536879624]
    [New Thread 536878128]
    [New Remote target]
    [Switching to Thread 57005]

    Thread 8 hit Breakpoint 3, k_sys_fatal_error_handler (reason=reason@entry=36, esf=esf@entry=0x20003fcc <z_interrupt_stacks+1988>) at C:/ncs/sdk/v2.8.0/zephyr/kernel/fatal.c:39
    39 {
    Execute debugger commands using "-exec <command>" or "`<command>", for example "-exec info registers" or "`info registers" will list registers in use (when GDB is the debugger)
    [New Remote target]
    /__w/_temp/workspace/build/.build/HOST-x86_64-w64-mingw32/arm-zephyr-eabi/src/gdb/gdb/infrun.c:5825: internal-error: finish_step_over: Assertion `ecs->event_thread->control.trap_expected' failed.
    A problem internal to GDB has been detected,
    further debugging may prove unreliable.
    Quit this debugging session? (y or n) [answered Y; input not from terminal]
    /__w/_temp/workspace/build/.build/HOST-x86_64-w64-mingw32/arm-zephyr-eabi/src/gdb/gdb/infrun.c:5825: internal-error: finish_step_over: Assertion `ecs->event_thread->control.trap_expected' failed.
    A problem internal to GDB has been detected,
    further debugging may prove unreliable.
    Create a core file of GDB? (y or n) [answered Y; input not from terminal]
    ERROR: GDB exited unexpectedly with exit code 3 (0x3). Debugging will now abort.
    The program 'c:/ncs/projects/l2_e1_sol/build_nrf54l15dk_debug/l2_e1_sol/zephyr/zephyr.elf' has exited with code -1 (0xffffffff).

    TERMINAL

    *** Booting nRF Connect SDK v2.8.0-a2386bfc8401 ***
    *** Using Zephyr OS v3.7.99-0bc3393fb112 ***
    [00:00:00.000,262] <inf> Lesson2_Exercise1: Starting Lesson 2 - Exercise 1

    [00:00:00.000,349] <inf> bt_sdc_hci_driver: SoftDevice Controller build revision:
    fe 2c f9 6a 7f 36 22 2e a0 79 c0 40 be 2c 03 20 |.,.j.6". .y.@.,.
    40 c2 f3 32 |@..2
    [00:00:00.001,345] <inf> bt_hci_core: HW Platform: Nordic Semiconductor (0x0002)
    [00:00:00.001,361] <inf> bt_hci_core: HW Variant: nRF54Lx (0x0005)
    [00:00:00.001,376] <inf> bt_hci_core: Firmware: Standard Bluetooth controller (0x00) Version 254.63788 Build 573996906
    [00:00:00.001,816] <inf> bt_hci_core: Identity: F0:51:9D:BB:69:4E (random)
    [00:00:00.001,834] <inf> bt_hci_core: HCI: version 6.0 (0x0e) revision 0x304e, manufacturer 0x0059
    [00:00:00.001,849] <inf> bt_hci_core: LMP: version 6.0 (0x0e) subver 0x304e
    [00:00:00.001,855] <inf> Lesson2_Exercise1: Bluetooth initialized

    [00:00:00.002,557] <inf> Lesson2_Exercise1: Advertising successfully started

    *** Booting nRF Connect SDK v2.8.0-a2386bfc8401 ***
    *** Using Zephyr OS v3.7.99-0bc3393fb112 ***
    [00:00:00.000,262] <inf> Lesson2_Exercise1: Starting Lesson 2 - Exercise 1

    [00:00:00.000,349] <inf> bt_sdc_hci_driver: SoftDevice Controller build revision:
    fe 2c f9 6a 7f 36 22 2e a0 79 c0 40 be 2c 03 20 |.,.j.6". .y.@.,.
    40 c2 f3 32 |@..2
    [00:00:00.001,345] <inf> bt_hci_core: HW Platform: Nordic Semiconductor (0x0002)
    [00:00:00.001,361] <inf> bt_hci_core: HW Variant: nRF54Lx (0x0005)
    [00:00:00.001,376] <inf> bt_hci_core: Firmware: Standard Bluetooth controller (0x00) Version 254.63788 Build 573996906
    [00:00:00.001,816] <inf> bt_hci_core: Identity: F0:51:9D:BB:69:4E (random)
    [00:00:00.001,834] <inf> bt_hci_core: HCI: version 6.0 (0x0e) revision 0x304e, manufacturer 0x0059
    [00:00:00.001,849] <inf> bt_hci_core: LMP: version 6.0 (0x0e) subver 0x304e
    [00:00:00.001,855] <inf> Lesson2_Exercise1: Bluetooth initialized

    [00:00:00.002,558] <inf> Lesson2_Exercise1: Advertising successfully started

    [00:00:00.010,999] <dbg> bt_hci_core: bt_send: buf 0x200057e0 len 4 type 0
    [00:00:00.011,007] <dbg> bt_sdc_hci_driver: hci_driver_send:
    --- 735 messages dropped ---
    [00:00:00.011,098] <dbg> os: z_impl_k_mutex_unlock: mutex 0x20000574 lock_count: 1
    [00:00:00.011,112] <dbg> os: z_impl_k_mutex_unlock: new owner of mutex 0x20000574: 0 (prio: -1000)
    [00:00:00.011,128] <dbg> bt_sdc_hci_driver: hci_driver_send: Exit: 0
    [00:00:00.011,140] <dbg> bt_hci_core: bt_tx_irq_raise: kick TX
    [00:00:00.011,167] <dbg> os: z_impl_k_mutex_lock: 0x20001f90 took mutex 0x20000574, count: 1, orig prio: -10
    [00:00:00.011,179] <dbg> os: z_impl_k_mutex_unlock: mutex 0x20000574 lock_count: 1
    [00:00:00.011,191] <dbg> os: z_impl_k_mutex_unlock: new owner of mutex 0x20000574: 0 (prio: -1000)
    [00:00:00.011,208] <dbg> bt_sdc_hci_driver: event_packet_process: Command Complete (0x200a) status: 0x00, ncmd: 1, len 4
    [00:00:00.011,230] <dbg> bt_hci_core: bt_recv_unsafe: buf 0x20005734 len 6
    [00:00:00.011,242] <dbg> bt_hci_core: hci_cmd_complete: opcode 0x200a
    [00:00:00.011,269] <dbg> bt_hci_core: hci_cmd_done: opcode 0x200a status 0x00 buf 0x20005734
    [00:00:00.011,284] <dbg> bt_hci_core: hci_cmd_done: sync cmd released
    [00:00:00.011,299] <dbg> bt_hci_core: bt_tx_irq_raise: kick TX
    [00:00:00.011,319] <dbg> os: k_sched_unlock: scheduler unlocked (0x20001f90:0)
    [00:00:00.011,342] <dbg> os: z_impl_k_mutex_lock: 0x20001f90 took mutex 0x20000574, count: 1, orig prio: -10
    [00:00:00.011,358] <dbg> os: z_impl_k_mutex_unlock: mutex 0x20000574 lock_count: 1
    [00:00:00.011,374] <dbg> os: z_impl_k_mutex_unlock: new owner of mutex 0x20000574: 0 (prio: -1000)
    [00:00:00.011,391] <dbg> bt_hci_core: tx_processor: TX process start
    [00:00:00.011,416] <dbg> bt_hci_core: bt_hci_cmd_send_sync: rsp 0x200057e0 opcode 0x200a len 1
    [00:00:00.011,429] <inf> Lesson2_Exercise1: Advertising successfully started

    [00:00:00.011,449] <dbg> os: z_tick_sleep: thread 0x20002140 for 31250 ticks
    [00:00:00.021,289] <dbg> os: z_impl_k_mutex_lock: 0x20001f90 took mutex 0x20000574, count: 1, orig prio: -10
    [00:00:00.021,318] <dbg> os: z_impl_k_mutex_unlock: mutex 0x20000574 lock_count: 1
    [00:00:00.021,328] <dbg> os: z_impl_k_mutex_unlock: new owner of mutex 0x20000574: 0 (prio: -1000)
    [00:00:00.129,102] <dbg> os: z_impl_k_mutex_lock: 0x20001f90 took mutex 0x20000574, count: 1, orig prio: -10
    [00:00:00.129,117] <dbg> os: z_impl_k_mutex_unlock: mutex 0x20000574 lock_count: 1
    [00:00:00.129,126] <dbg> os: z_impl_k_mutex_unlock: new owner of mutex 0x20000574: 0 (prio: -1000)
    [00:00:00.230,301] <dbg> os: z_impl_k_mutex_lock: 0x20001f90 took mutex 0x20000574, count: 1, orig prio: -10
    [00:00:00.230,316] <dbg> os: z_impl_k_mutex_unlock: mutex 0x20000574 lock_count: 1
    [00:00:00.230,326] <dbg> os: z_impl_k_mutex_unlock: new owner of mutex 0x20000574: 0 (prio: -1000)
    [00:00:00.336,154] <dbg> os: z_impl_k_mutex_lock: 0x20001f90 took mutex 0x20000574, count: 1, orig prio: -10
    [00:00:00.336,174] <dbg> os: z_impl_k_mutex_unlock: mutex 0x20000574 lock_count: 1
    [00:00:00.336,184] <dbg> os: z_impl_k_mutex_unlock: new owner of mutex 0x20000574: 0 (prio: -1000)
    [00:00:00.440,242] <dbg> os: z_impl_k_mutex_lock: 0x20001f90 took mutex 0x20000574, count: 1, orig prio: -10
    [00:00:00.440,257] <dbg> os: z_impl_k_mutex_unlock: mutex 0x20000574 lock_count: 1
    [00:00:00.440,267] <dbg> os: z_impl_k_mutex_unlock: new owner of mutex 0x20000574: 0 (prio: -1000)
    [00:00:00.549,260] <dbg> os: z_impl_k_mutex_lock: 0x20001f90 took mutex 0x20000574, count: 1, orig prio: -10
    [00:00:00.549,274] <dbg> os: z_impl_k_mutex_unlock: mutex 0x20000574 lock_count: 1
    [00:00:00.549,284] <dbg> os: z_impl_k_mutex_unlock: new owner of mutex 0x20000574: 0 (prio: -1000)
    [00:00:00.655,364] <dbg> os: z_impl_k_mutex_lock: 0x20001f90 took mutex 0x20000574, count: 1, orig prio: -10
    [00:00:00.655,385] <dbg> os: z_impl_k_mutex_unlock: mutex 0x20000574 lock_count: 1
    [00:00:00.655,395] <dbg> os: z_impl_k_mutex_unlock: new owner of mutex 0x20000574: 0 (prio: -1000)
    [00:00:00.760,709] <dbg> os: z_impl_k_mutex_lock: 0x20001f90 took mutex 0x20000574, count: 1, orig prio: -10
    [00:00:00.760,730] <dbg> os: z_impl_k_mutex_unlock: mutex 0x20000574 lock_count: 1
    [00:00:00.760,740] <dbg> os: z_impl_k_mutex_unlock: new owner of mutex 0x20000574: 0 (prio: -1000)

Reply
  • Hi Vidar,

    I continued execution as you mentioned. Before, I set CONFIG_LOG_DEFAULT_LEVEL=4 to log a maximum of information.
    I copied below the DEBUG CONSOLE and TERMINAL outputs.
    On the play button press, no more information is logged in the TERMINAL. Concerning the DEBUG CONSOLE I highlighted in yellow the last information logged before continuing debug.
    Hope it will help to find the root cause.

    DEBUG CONSOLE

    JLinkGDBServerCL: SEGGER J-Link GDB Server V7.94i Command Line Version
    JLinkGDBServerCL:
    JLinkGDBServerCL: JLinkARM.dll V7.94i (DLL compiled Feb 7 2024 17:08:52)
    JLinkGDBServerCL:
    JLinkGDBServerCL: -----GDB Server start settings-----
    JLinkGDBServerCL: GDBInit file: none
    JLinkGDBServerCL: GDB Server Listening port: 51059
    JLinkGDBServerCL: SWO raw output listening port: 2332
    JLinkGDBServerCL: Terminal I/O port: 2333
    JLinkGDBServerCL: Accept remote connection: localhost only
    JLinkGDBServerCL: Generate logfile: off
    JLinkGDBServerCL: Verify download: off
    JLinkGDBServerCL: Init regs on start: off
    JLinkGDBServerCL: Silent mode: on
    JLinkGDBServerCL: Single run mode: on
    JLinkGDBServerCL: Target connection timeout: 0 ms
    JLinkGDBServerCL: ------J-Link related settings------
    JLinkGDBServerCL: J-Link Host interface: USB
    JLinkGDBServerCL: J-Link script: none
    JLinkGDBServerCL: J-Link settings file: none
    JLinkGDBServerCL: ------Target related settings------
    JLinkGDBServerCL: Target device: cortex-m33
    JLinkGDBServerCL: Target device parameters: none
    JLinkGDBServerCL: Target interface: SWD
    JLinkGDBServerCL: Target interface speed: 12000kHz
    JLinkGDBServerCL: Target endian: little
    JLinkGDBServerCL:
    =thread-group-added,id="i1"
    =cmd-param-changed,param="pagination",value="off"
    __enable_irq () at C:/ncs/sdk/v2.8.0/modules/hal/cmsis/CMSIS/Core/Include/cmsis_gcc.h:951
    951 __ASM volatile ("cpsie i" : : : "memory");
    [New Thread 536879424]
    [New Thread 536879224]
    [New Thread 536876840]
    [New Thread 536878992]
    [New Thread 536879624]
    [New Thread 536878128]
    [New Remote target]
    [Switching to Thread 57005]

    Thread 8 hit Breakpoint 3, k_sys_fatal_error_handler (reason=reason@entry=36, esf=esf@entry=0x20003fcc <z_interrupt_stacks+1988>) at C:/ncs/sdk/v2.8.0/zephyr/kernel/fatal.c:39
    39 {
    Execute debugger commands using "-exec <command>" or "`<command>", for example "-exec info registers" or "`info registers" will list registers in use (when GDB is the debugger)
    [New Remote target]
    /__w/_temp/workspace/build/.build/HOST-x86_64-w64-mingw32/arm-zephyr-eabi/src/gdb/gdb/infrun.c:5825: internal-error: finish_step_over: Assertion `ecs->event_thread->control.trap_expected' failed.
    A problem internal to GDB has been detected,
    further debugging may prove unreliable.
    Quit this debugging session? (y or n) [answered Y; input not from terminal]
    /__w/_temp/workspace/build/.build/HOST-x86_64-w64-mingw32/arm-zephyr-eabi/src/gdb/gdb/infrun.c:5825: internal-error: finish_step_over: Assertion `ecs->event_thread->control.trap_expected' failed.
    A problem internal to GDB has been detected,
    further debugging may prove unreliable.
    Create a core file of GDB? (y or n) [answered Y; input not from terminal]
    ERROR: GDB exited unexpectedly with exit code 3 (0x3). Debugging will now abort.
    The program 'c:/ncs/projects/l2_e1_sol/build_nrf54l15dk_debug/l2_e1_sol/zephyr/zephyr.elf' has exited with code -1 (0xffffffff).

    TERMINAL

    *** Booting nRF Connect SDK v2.8.0-a2386bfc8401 ***
    *** Using Zephyr OS v3.7.99-0bc3393fb112 ***
    [00:00:00.000,262] <inf> Lesson2_Exercise1: Starting Lesson 2 - Exercise 1

    [00:00:00.000,349] <inf> bt_sdc_hci_driver: SoftDevice Controller build revision:
    fe 2c f9 6a 7f 36 22 2e a0 79 c0 40 be 2c 03 20 |.,.j.6". .y.@.,.
    40 c2 f3 32 |@..2
    [00:00:00.001,345] <inf> bt_hci_core: HW Platform: Nordic Semiconductor (0x0002)
    [00:00:00.001,361] <inf> bt_hci_core: HW Variant: nRF54Lx (0x0005)
    [00:00:00.001,376] <inf> bt_hci_core: Firmware: Standard Bluetooth controller (0x00) Version 254.63788 Build 573996906
    [00:00:00.001,816] <inf> bt_hci_core: Identity: F0:51:9D:BB:69:4E (random)
    [00:00:00.001,834] <inf> bt_hci_core: HCI: version 6.0 (0x0e) revision 0x304e, manufacturer 0x0059
    [00:00:00.001,849] <inf> bt_hci_core: LMP: version 6.0 (0x0e) subver 0x304e
    [00:00:00.001,855] <inf> Lesson2_Exercise1: Bluetooth initialized

    [00:00:00.002,557] <inf> Lesson2_Exercise1: Advertising successfully started

    *** Booting nRF Connect SDK v2.8.0-a2386bfc8401 ***
    *** Using Zephyr OS v3.7.99-0bc3393fb112 ***
    [00:00:00.000,262] <inf> Lesson2_Exercise1: Starting Lesson 2 - Exercise 1

    [00:00:00.000,349] <inf> bt_sdc_hci_driver: SoftDevice Controller build revision:
    fe 2c f9 6a 7f 36 22 2e a0 79 c0 40 be 2c 03 20 |.,.j.6". .y.@.,.
    40 c2 f3 32 |@..2
    [00:00:00.001,345] <inf> bt_hci_core: HW Platform: Nordic Semiconductor (0x0002)
    [00:00:00.001,361] <inf> bt_hci_core: HW Variant: nRF54Lx (0x0005)
    [00:00:00.001,376] <inf> bt_hci_core: Firmware: Standard Bluetooth controller (0x00) Version 254.63788 Build 573996906
    [00:00:00.001,816] <inf> bt_hci_core: Identity: F0:51:9D:BB:69:4E (random)
    [00:00:00.001,834] <inf> bt_hci_core: HCI: version 6.0 (0x0e) revision 0x304e, manufacturer 0x0059
    [00:00:00.001,849] <inf> bt_hci_core: LMP: version 6.0 (0x0e) subver 0x304e
    [00:00:00.001,855] <inf> Lesson2_Exercise1: Bluetooth initialized

    [00:00:00.002,558] <inf> Lesson2_Exercise1: Advertising successfully started

    [00:00:00.010,999] <dbg> bt_hci_core: bt_send: buf 0x200057e0 len 4 type 0
    [00:00:00.011,007] <dbg> bt_sdc_hci_driver: hci_driver_send:
    --- 735 messages dropped ---
    [00:00:00.011,098] <dbg> os: z_impl_k_mutex_unlock: mutex 0x20000574 lock_count: 1
    [00:00:00.011,112] <dbg> os: z_impl_k_mutex_unlock: new owner of mutex 0x20000574: 0 (prio: -1000)
    [00:00:00.011,128] <dbg> bt_sdc_hci_driver: hci_driver_send: Exit: 0
    [00:00:00.011,140] <dbg> bt_hci_core: bt_tx_irq_raise: kick TX
    [00:00:00.011,167] <dbg> os: z_impl_k_mutex_lock: 0x20001f90 took mutex 0x20000574, count: 1, orig prio: -10
    [00:00:00.011,179] <dbg> os: z_impl_k_mutex_unlock: mutex 0x20000574 lock_count: 1
    [00:00:00.011,191] <dbg> os: z_impl_k_mutex_unlock: new owner of mutex 0x20000574: 0 (prio: -1000)
    [00:00:00.011,208] <dbg> bt_sdc_hci_driver: event_packet_process: Command Complete (0x200a) status: 0x00, ncmd: 1, len 4
    [00:00:00.011,230] <dbg> bt_hci_core: bt_recv_unsafe: buf 0x20005734 len 6
    [00:00:00.011,242] <dbg> bt_hci_core: hci_cmd_complete: opcode 0x200a
    [00:00:00.011,269] <dbg> bt_hci_core: hci_cmd_done: opcode 0x200a status 0x00 buf 0x20005734
    [00:00:00.011,284] <dbg> bt_hci_core: hci_cmd_done: sync cmd released
    [00:00:00.011,299] <dbg> bt_hci_core: bt_tx_irq_raise: kick TX
    [00:00:00.011,319] <dbg> os: k_sched_unlock: scheduler unlocked (0x20001f90:0)
    [00:00:00.011,342] <dbg> os: z_impl_k_mutex_lock: 0x20001f90 took mutex 0x20000574, count: 1, orig prio: -10
    [00:00:00.011,358] <dbg> os: z_impl_k_mutex_unlock: mutex 0x20000574 lock_count: 1
    [00:00:00.011,374] <dbg> os: z_impl_k_mutex_unlock: new owner of mutex 0x20000574: 0 (prio: -1000)
    [00:00:00.011,391] <dbg> bt_hci_core: tx_processor: TX process start
    [00:00:00.011,416] <dbg> bt_hci_core: bt_hci_cmd_send_sync: rsp 0x200057e0 opcode 0x200a len 1
    [00:00:00.011,429] <inf> Lesson2_Exercise1: Advertising successfully started

    [00:00:00.011,449] <dbg> os: z_tick_sleep: thread 0x20002140 for 31250 ticks
    [00:00:00.021,289] <dbg> os: z_impl_k_mutex_lock: 0x20001f90 took mutex 0x20000574, count: 1, orig prio: -10
    [00:00:00.021,318] <dbg> os: z_impl_k_mutex_unlock: mutex 0x20000574 lock_count: 1
    [00:00:00.021,328] <dbg> os: z_impl_k_mutex_unlock: new owner of mutex 0x20000574: 0 (prio: -1000)
    [00:00:00.129,102] <dbg> os: z_impl_k_mutex_lock: 0x20001f90 took mutex 0x20000574, count: 1, orig prio: -10
    [00:00:00.129,117] <dbg> os: z_impl_k_mutex_unlock: mutex 0x20000574 lock_count: 1
    [00:00:00.129,126] <dbg> os: z_impl_k_mutex_unlock: new owner of mutex 0x20000574: 0 (prio: -1000)
    [00:00:00.230,301] <dbg> os: z_impl_k_mutex_lock: 0x20001f90 took mutex 0x20000574, count: 1, orig prio: -10
    [00:00:00.230,316] <dbg> os: z_impl_k_mutex_unlock: mutex 0x20000574 lock_count: 1
    [00:00:00.230,326] <dbg> os: z_impl_k_mutex_unlock: new owner of mutex 0x20000574: 0 (prio: -1000)
    [00:00:00.336,154] <dbg> os: z_impl_k_mutex_lock: 0x20001f90 took mutex 0x20000574, count: 1, orig prio: -10
    [00:00:00.336,174] <dbg> os: z_impl_k_mutex_unlock: mutex 0x20000574 lock_count: 1
    [00:00:00.336,184] <dbg> os: z_impl_k_mutex_unlock: new owner of mutex 0x20000574: 0 (prio: -1000)
    [00:00:00.440,242] <dbg> os: z_impl_k_mutex_lock: 0x20001f90 took mutex 0x20000574, count: 1, orig prio: -10
    [00:00:00.440,257] <dbg> os: z_impl_k_mutex_unlock: mutex 0x20000574 lock_count: 1
    [00:00:00.440,267] <dbg> os: z_impl_k_mutex_unlock: new owner of mutex 0x20000574: 0 (prio: -1000)
    [00:00:00.549,260] <dbg> os: z_impl_k_mutex_lock: 0x20001f90 took mutex 0x20000574, count: 1, orig prio: -10
    [00:00:00.549,274] <dbg> os: z_impl_k_mutex_unlock: mutex 0x20000574 lock_count: 1
    [00:00:00.549,284] <dbg> os: z_impl_k_mutex_unlock: new owner of mutex 0x20000574: 0 (prio: -1000)
    [00:00:00.655,364] <dbg> os: z_impl_k_mutex_lock: 0x20001f90 took mutex 0x20000574, count: 1, orig prio: -10
    [00:00:00.655,385] <dbg> os: z_impl_k_mutex_unlock: mutex 0x20000574 lock_count: 1
    [00:00:00.655,395] <dbg> os: z_impl_k_mutex_unlock: new owner of mutex 0x20000574: 0 (prio: -1000)
    [00:00:00.760,709] <dbg> os: z_impl_k_mutex_lock: 0x20001f90 took mutex 0x20000574, count: 1, orig prio: -10
    [00:00:00.760,730] <dbg> os: z_impl_k_mutex_unlock: mutex 0x20000574 lock_count: 1
    [00:00:00.760,740] <dbg> os: z_impl_k_mutex_unlock: new owner of mutex 0x20000574: 0 (prio: -1000)

Children
  • Hi,

    As you can see, increasing the default log level for all SDK modules to "debug" does lead to a lot of messages and sometimes dropped log messages. I suggest lowering the the log level for now and instead set CONFIG_RESET_ON_FATAL_ERROR=n to see if we can get the error log from the error handler.

  • Hi,

    Setting the CONFIG_RESET_ON_FATAL_ERROR=n doesn't generate much more error log when I am going ahead in the debug. Instead, the debug session seems to "stop".
    By the way, is there a Nordic engineer who was able to reproduce the same issue on VS code with the nRF54L15DK board ? Am I the only one facing such debugging issue ?

    I just realized that, unlike nRF52 toolchain, the nRF54 series requires to install nrfutil tool to flash and debug with VS code. This nrfutil tool installation is not clearly described in the nRF Connect for VS Code web page.
    Yet, I download the last version of this tool and installed it on my windows computer. I am just wondering if the version of nrfutil I downloaded, or the way I installed it, could affect the VS code debugger behavior.
    By the way, I tried to setup a new development environment on a Ubuntu OS but I am facing exactly the same behavior when I try to debug these examples.

  • Hello,

    Can you try to switch to v2.9.0 and see if it has improved?

    In VS code you need to install both the nRF Connect SDK v2.9.0 and the toolchain for v2.9.0.

    In addition I do believe you need to install both the nRF Command line tools and add nrfutil to system path. Also update it by running "nrfutil -self-upgrade" and "nrfutil install device" and "nrfutil upgrade device". Finally run for instance "nrfutil device recover --traits devkit" to check that it works.

    I can't see any specific reason why you should have problem with Bluetooth projects, other than you can't single step with Bluetooth projects, since this will break the real-time handling. So you can only set a breakpoint, and then restart to run one more time.

    Kenneth

  • his will break the real-time han

    Hello,

    To tell the truth, I started to experiment the BLE Fundamentals examples with SDK and toolchain v2.9.0.and I faced the same debugging issue. I decided to go back to v2.8.0 since BLE Fundamentals examples are specified to be compliant with SDK up to v2.8.x (even if I guess v2.9.x should not be a problem).

    Anyway, I installed the latest SDK/toolchain v2.9.0 again on my VS code environment and I updated the nrfutil according to your last post.

    Here the status about nrfutil


    C:\ncs\tools>nrfutil list
    Command Version Description
    completion 1.5.0
    device 2.7.12 Manage and program devices
    nrf5sdk-tools 1.1.0 nRF5 SDK tools that were available in nRF Util 6
    dfu
    keys
    pkg
    settings
    zigbee

    C:\ncs\tools>nrfutil device recover --traits devkit
    v Recovered 1057797634


    Unfortunately, these updates don't change the behavior :the debugger doesn't stop at the main entry point or any breakpoint I manually place.

  • Do you use Optimize for debugging?

    If still no luck, maybe give Ozone a try?
    https://www.segger.com/products/development-tools/ozone-j-link-debugger/ 

    Then you can click on Debug with Ozone from the ACTIONS window instead.

    Kenneth

Related