I am trying to debug an application in VS Code for the nRF52840 DK in the nRF Connect SDK.
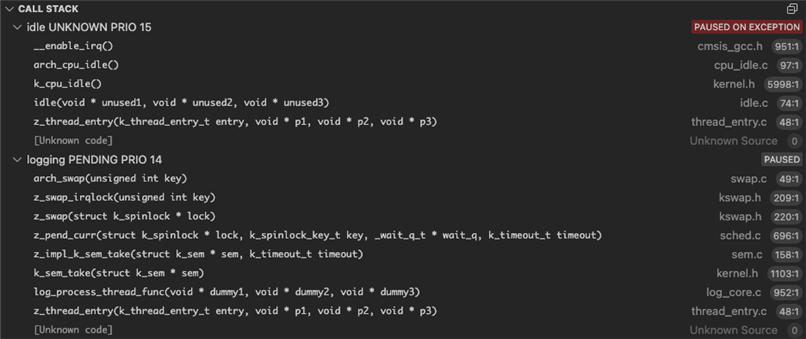
After starting debugging, I immediately get this error: "Exception has occurred. Debugger was unable to continue the process".
This occurs at line 951 of cmsis_gcc.h:
__STATIC_FORCEINLINE void __enable_irq(void)
{
  __ASM volatile ("cpsie i" : : : "memory");
}
When a breakpoint is placed before __enable_irq(void) is called, the above error occurs at line 73 in reset.S instead:
#if defined(CONFIG_DEBUG_THREAD_INFO)
    /* Clear z_sys_post_kernel flag for RTOS aware debuggers */
    movs.n r0, #0
This is the prj.conf for the non-debug build.
CONFIG_LOG=y
CONFIG_ADC=y

# Bluetooth LE
CONFIG_BT=y
CONFIG_BT_PERIPHERAL=y
CONFIG_BT_DEVICE_NAME="ABC"

CONFIG_BT_SMP=y
CONFIG_BT_GATT_CLIENT=y
CONFIG_BT_GATT_DM=y

CONFIG_BT_DIS=n
CONFIG_BT_DIS_PNP=n

CONFIG_BT_GATT_DM_LOG_LEVEL_DBG=y

# CTS
CONFIG_BT_CTS_CLIENT=y

# config_bt_settings dependencies
CONFIG_SETTINGS=y
CONFIG_BT_HCI=y

# BT Bonding
CONFIG_BT_SETTINGS=y
CONFIG_BT_SETTINGS_LOG_LEVEL_DBG=y
CONFIG_FLASH=y
CONFIG_FLASH_PAGE_LAYOUT=y
CONFIG_FLASH_MAP=y

CONFIG_BT_KEYS_LOG_LEVEL_DBG=y

CONFIG_SETTINGS_NVS=y
CONFIG_NVS=y
CONFIG_MPU_ALLOW_FLASH_WRITE=y
CONFIG_NVS_LOG_LEVEL_DBG=y

CONFIG_HEAP_MEM_POOL_SIZE=1024

#so sniffer can decode encrypted packets
CONFIG_BT_LOG_SNIFFER_INFO=y
The .conf file for the debug build is the same as above, but with the following additions:
#debugging options
CONFIG_DEBUG_OPTIMIZATIONS=y
CONFIG_DEBUG_THREAD_INFO=y
CONFIG_CORTEX_M_DEBUG_MONITOR_HOOK=y
CONFIG_SEGGER_DEBUGMON=y
When the application is compiled without the debug options enabled, the build is flashed successfully and behaves as expected.
The Blinky and Central-and-Peripheral-HRS samples can be debugged as normal, so I think there's an issue with my application.
I have tried reinstalling the JLink driver, switching cables, switching ports and switching DK boards but none of these have resolved the issue.
SDK Version: v2.8.0
JLink Version: v7.94i