Hello,
We are using the nRF52840 on our own board.
When I added up the current consumption at 3V, based on the datasheet, I get 14.3mA (CPU from RAM, Tx at 0dBm 1Mbps, ADC, Timer at 16MHz).
So at 3V, this should be 42.9mW.
For my design, I am using VDDH, and a LiPoly battery (up to 4.2V). But for the current consumption test, I used a bench supply set to 4.1V and your Power Profiler II.
For 42.9mW, and at 4.1V based on the datasheet, I should be getting 10.5mA (assuming perfect DCDC)
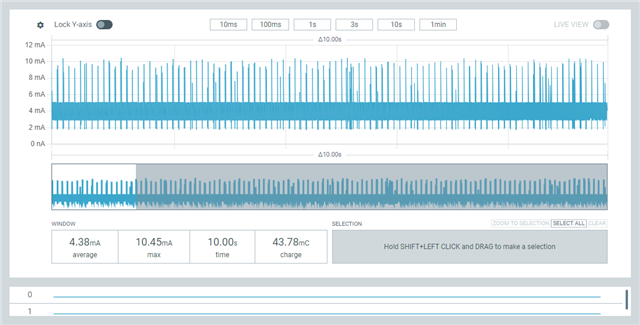
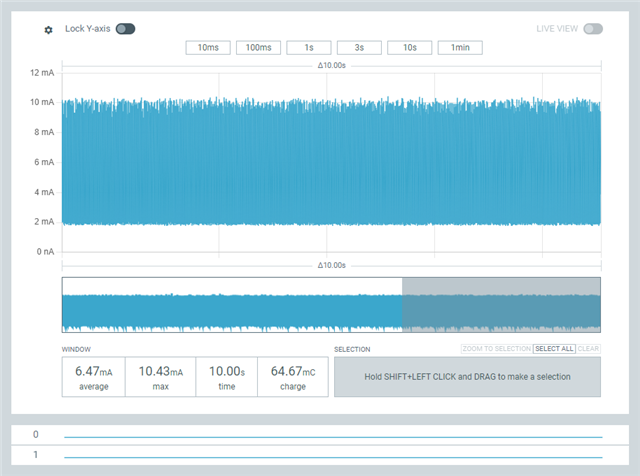
However, with the Power Profiler II, I am reading 6.3mA average (over 10 sec) and peak of 10.6mA.
Why would I see such a large difference? Is the current consumption in the datasheet an average current or peak current? Just trying to understand where the difference is coming from.
Sincerely,
Vinson Go, Duke University