VSCode debugger exception

I am using VSCode with the nRF Connect extension (latest) and SDK 2.9.1.

I made my new app from the Bluetooth Peripheral sample.

When I try to debug I get the following exception:

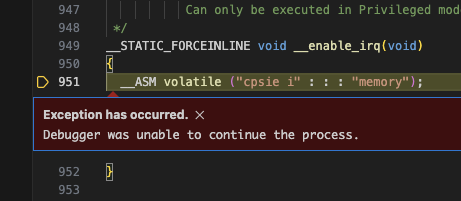
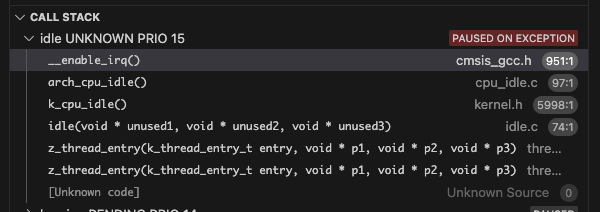
Here is the call stack:

I started getting this yesterday and at one point is just stopped doing it and I was able to move on and debug my app. Then this morning I came in and started working and the first time debugging it started doing it again. I didn't change anything from last night to now. I just closed VSCode and started it again today.

If I stop debugging and start again I get the same exception in the same place.

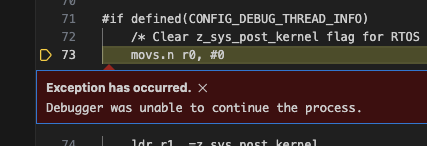
If I hit the recycle or restart button on the debug toolbar: 

I get an exception in a different place, but probably related:

Callstack:

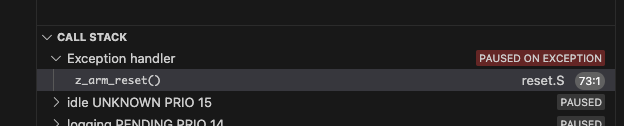
That appears to just be the fact that it was in an exception when I hit the restart button and so it is still inside the exception handler. Just wanted to give as much information as I can.

Parents
  • Normal behaviour for any of the single core MCU once softdevice/BT was enabled.

    The softdevice will always fault due to the BT timing violation when the MCU was stopped for debugging.

    Breakpoints will work when set before app start, but you will never be able to "continue".

    The only exception is on the NRF5340 dual core MCU - because the debugger won't stop the network core here.

Reply
  • Normal behaviour for any of the single core MCU once softdevice/BT was enabled.

    The softdevice will always fault due to the BT timing violation when the MCU was stopped for debugging.

    Breakpoints will work when set before app start, but you will never be able to "continue".

    The only exception is on the NRF5340 dual core MCU - because the debugger won't stop the network core here.

Children
  • How do I hit even the first breakpoint? I am getting this exception right off the bat.

  • Turns out you are partially correct. I had several breakpoints all over the code. I decided to remove all breakpoints and put just one where I wanted it. i was able to debug by starting the debug, that just runs but isn't really running. Then I hit the restart button mentioned above and it starts over and breaks in the idle loop infinite loop and when I hit run it hits my breakpoint.

    This leads me to believe that the issue was one of my breakpoints being in a bad spot causing that exception.

    No idea where or how so closing this ticket.