I am using VSCode with the nRF Connect extension (latest) and SDK 2.9.1.
I made my new app from the Bluetooth Peripheral sample.
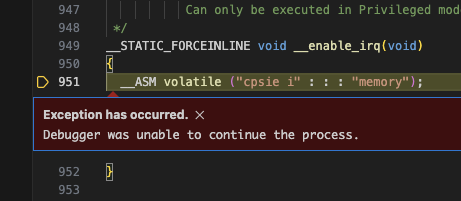
When I try to debug I get the following exception:

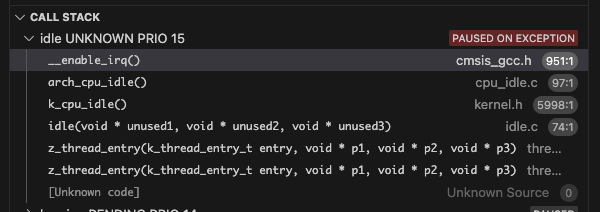
Here is the call stack:

I started getting this yesterday and at one point is just stopped doing it and I was able to move on and debug my app. Then this morning I came in and started working and the first time debugging it started doing it again. I didn't change anything from last night to now. I just closed VSCode and started it again today.
If I stop debugging and start again I get the same exception in the same place.
If I hit the recycle or restart button on the debug toolbar: 
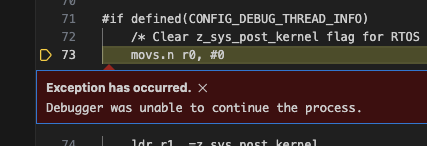
I get an exception in a different place, but probably related:

Callstack:

That appears to just be the fact that it was in an exception when I hit the restart button and so it is still inside the exception handler. Just wanted to give as much information as I can.


