Cannot boot due to image validation problems when running "west debug"

I boot AOK after I do a west flash --erase. But after that, when I try "west debug," I run into this:

*** Booting nRF Connect SDK v2.9.0-2e7ce73f5faf ***
*** Using Zephyr OS v3.7.99-1f8f3dc29142 ***
Attempting to boot slot 0.
Attempting to boot from address 0x8200.
I: Trying to get Firmware version
I: Verifying signature against key 0.
I: Hash: 0xf7...d2
I: Firmware signature verified.
Firmware version 1
*** Booting My Application v2.1.0-dev-12e5ee106034 ***
*** Using nRF Connect SDK v2.9.0-2e7ce73f5faf ***
*** Using Zephyr OS v3.7.99-1f8f3dc29142 ***
I: Starting bootloader
I: Primary image: magic=unset, swap_type=0x1, copy_done=0x3, image_ok=0x3
I: Secondary image: magic=unset, swap_type=0x1, copy_done=0x3, image_ok=0x3
I: Boot source: none
I: Image index: 0, Swap type: none
I: Primary image: magic=unset, swap_type=0x1, copy_done=0x3, image_ok=0x3
I: Secondary image: magic=unset, swap_type=0x1, copy_done=0x3, image_ok=0x3
I: Boot source: none
I: Image index: 1, Swap type: none
E: Image in the primary slot is not valid!
E: Unable to find bootable image

I found things mentioned about CONFIG_BOOT_VALIDATE_SLOT0=n added to sysbuild/mcuboot/prj.conf, but I end up with things like

ncs/v2.9.0/bootloader/mcuboot/boot/bootutil/src/loader.c: In function 'context_boot_go':
/home/burt/ncs/v2.9.0/bootloader/mcuboot/boot/bootutil/src/loader.c:2892:14: error: 'image_validated_by_nsib' undeclared (first use in this function)
 2892 |         if (!image_validated_by_nsib)

so I cannot create a build. I am working on asset_tracker_v2 in v2.9.0. Thank you for help.

Regards,

Burt Silverman

Parents
  • I am working on Linux. Also, back to the first case where I do not try anything with CONFIG_BOOT_VALIDATE_SLOT0=n, once the board gets stuck unable to find a bootable image, it is stuck that way with respect to a power on reset. I have to reflash the board to have it come up (without starting west debug, of course).

  • Okay, I found case 334803, where Vidar indicates that the trick is to use west attach to a board that has been flashed with the code to be debugged. And then I read about gdb's monitor reset command. So the steps are west attach followed by break main followed by continue. That will put me at main(), which is what I am accustomed to. This is really nice. Please give me a time frame where I can expect to see this spelled out clearly in the documentation: a few good hints can save developers like myself lots of time. Some of us prefer to use command line tools until/unless we need an enhanced user experience available with VS Code. Well mostly enhanced--I can't say that the required backtick ` before a gdb command is at all pleasurable.

    Burt Silverman

  • Hi Burt,

    I'm sorry to hear that you had to spend time to figure out this problem. I agree that this limitation needs to either be fixed or clearly documented. The issue is that the debugger loads the unsigned .elf file while only the .hex and .bin files are signed. I've raised a ticket in our internal bug tracker so the team can figure out the best way to address this. I will update this thread when I know more.

  • Thanks, Vidar, I will throw my 2 cents, "simpleton" recommendation in for good, clear documentation for the "west attach" approach. I have been using that over the last couple of days, and very happy with it. And what if I were debugging an application that crashed quickly after starting? In that case I guess I would have to add a sleep at the beginning of "main".

    Burt

Reply
  • Thanks, Vidar, I will throw my 2 cents, "simpleton" recommendation in for good, clear documentation for the "west attach" approach. I have been using that over the last couple of days, and very happy with it. And what if I were debugging an application that crashed quickly after starting? In that case I guess I would have to add a sleep at the beginning of "main".

    Burt

Children
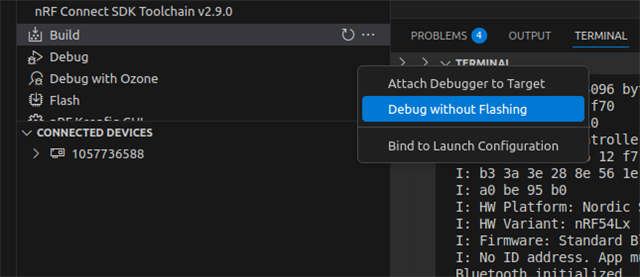
  • Thanks for the feedback. I provided a link to this thread in my bug report so the developers can see it. Regarding the attach option, maybe you've seen it already, but this is also possible to do via the extension through this button:


    And what if I were debugging an application that crashed quickly after starting? In that case I guess I would have to add a sleep at the beginning of "main".

    Is it that it is not breaking on main()? I guess you could add a breakpoint for it with 'b main' and then do a reset 'mon reset 0'. Disabling CONFIG_RESET_ON_FATAL_ERROR in the project configuration can also make it easier to catch a crash since it will prevent the device from potentially entering a boot loop.

Related