Hello,
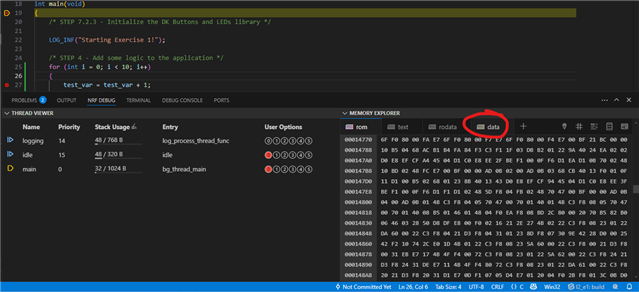
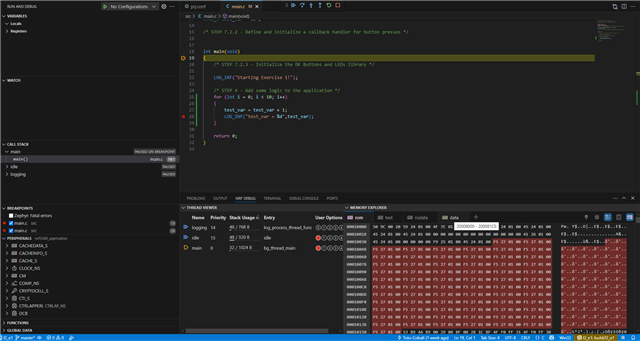
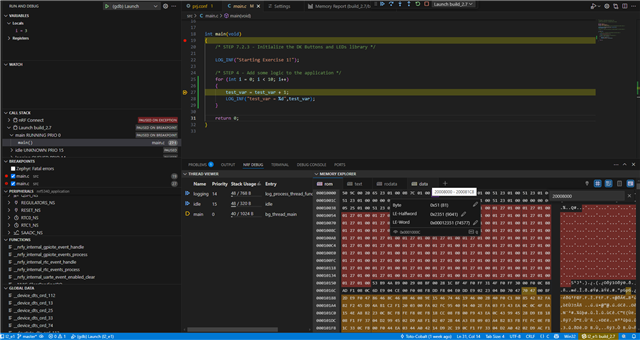
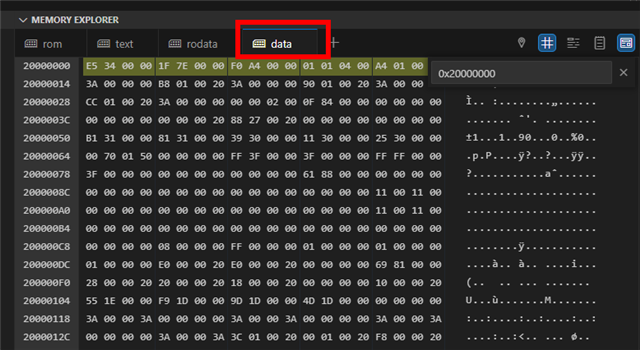
I am following the instruction on dev academy - nrf connect sdk intermediate lesson 2 excercise 1, but I can't select data tab on memory explorer.
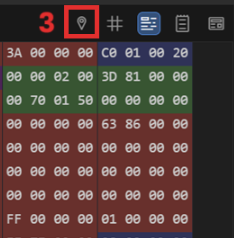
I can select only rom area.
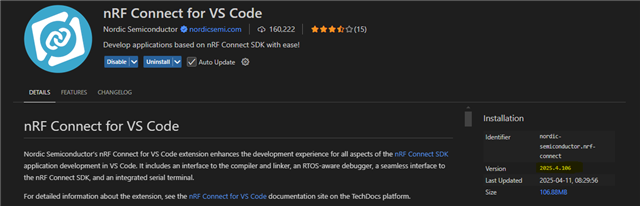
I wonder if I missed any settings in the VS Code or nRF Connect extension.
I am using
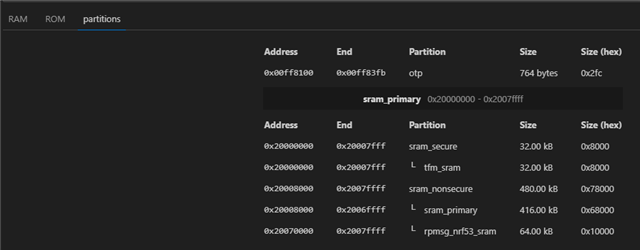
1. nRF5340DK
2. nRF Connect SDK 2.9.1
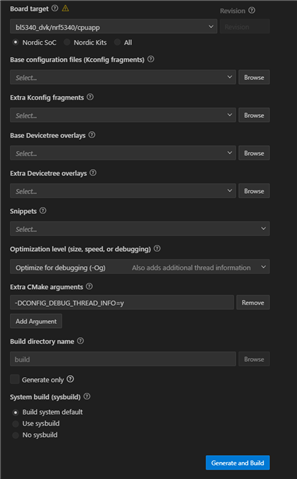
I also created the build with ns or without ns.
I wanted to find if any others have the same issues before, but I couldn't find.