Hello Nordic Team,
I am reaching out to ask for some advice and/or guidance on how I may debug code that:
1. Is initialized and runs BEFORE main
2. Is part of the zephyr library, not the application code I have written
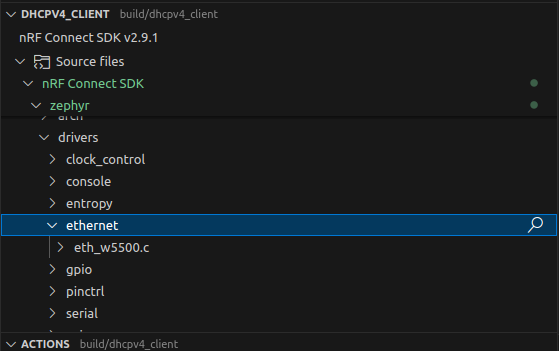
For example, I am using a nRF9151DK, and working with a Wiznet W5500 ethernet controller with SPI interface breakout board. I am using the Zephyr wiznet,w5500 driver as per my devicetree configuration in my overlay file, with an SPI interface. Currently I do not own an external SEGGER debug probe, and I have so far only used the onboard debugger. I have currently only been using the VS code nRF Connect Extension and its associated debugger GUI within VS code. I have completed the nRF Connect SDK fundamentals course and I have been working through the IoT and intermediate level courses, and I am aware that applications should be given compiler flags to 'optimize for debugging' so that the compiler does not 'optimize out' symbols used for debugging.
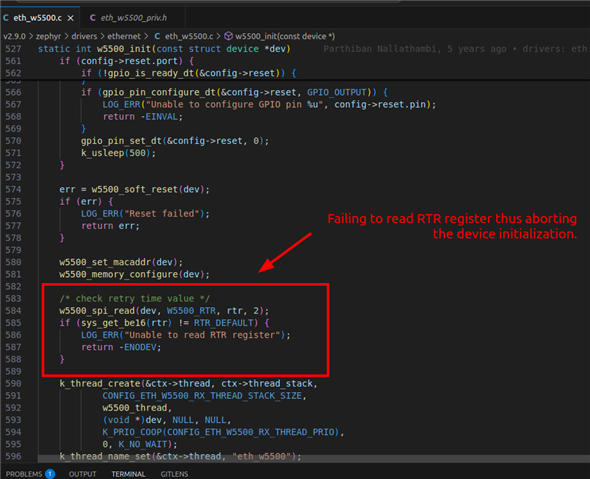
I have now been able to get the w5500 driver to initialize and I have verified the SPI interface is communicating correct via logic analyzer on the assocaited pins : MOSI, MISO, CS, SCLK, RST, INT. That being said, It took me a while to get this working properly given the lack of documentation and examples, as I was getting a 'cannot read RTR register' error from the driver, but I did not know how to go about debugging this given the error had nothing to do with the code I wrote / application layer stuff. I ended up using a different breakout board (I ordered a pack of 3), and it just worked, leading me to think that either my pinout was incorrect, or that specific board was a dud / DOA (it is a cheap amazon board with no documentation etc.). Regardless, I think it would be very useful in the future to know how to dig deeper if driver code in the future isn't working, to perhaps help me narrow down what to troubleshoot.
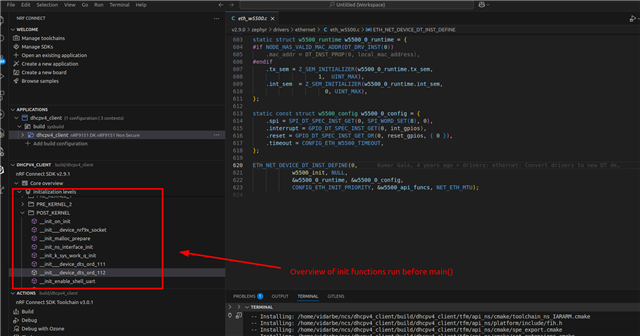
Given the layer of abstraction introduced through the use of a driver in the devicetree, which is configured and initialized BEFORE main, I have been left wondering how I can go about setting break points and debugging code that exists outside of the application layer code I have written, particularly the stuff before main.
I know this might be difficult, given the zephyr library code is compiled and linked at build time, although I know the nRF Connect SDK includes the Nordic fork of the Zephyr library, so I feel like it should be possible to do this.
Thank you very much for your time.