Hi
I am capturing a digital signal with the nRF PowerProfiler Kit II from my board that can either be 12Hz or 2kHz depending on the state of my application.
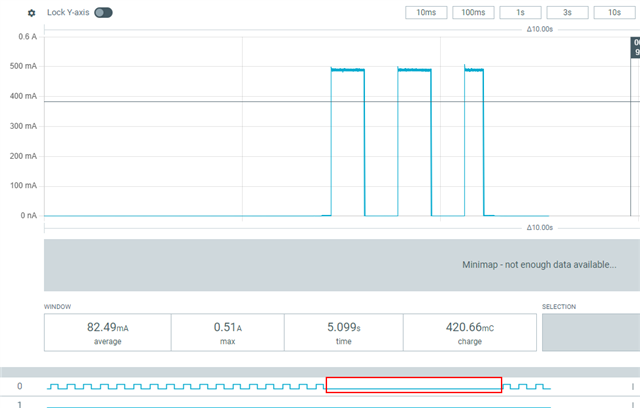
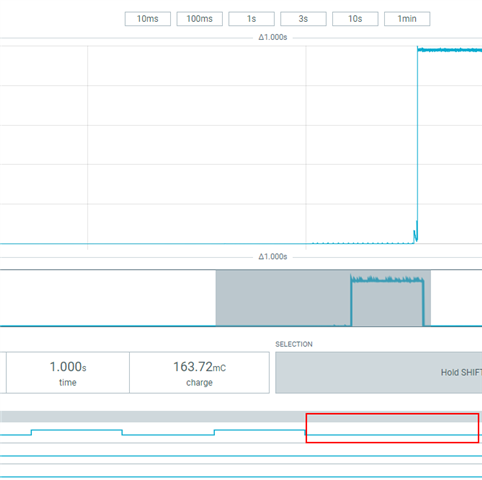
In the below screenshot the horizontal axis is set to 1sec. The 12Hz toggle is visible, but for the time with high current consumption logic analyser line is flat on LOW State:
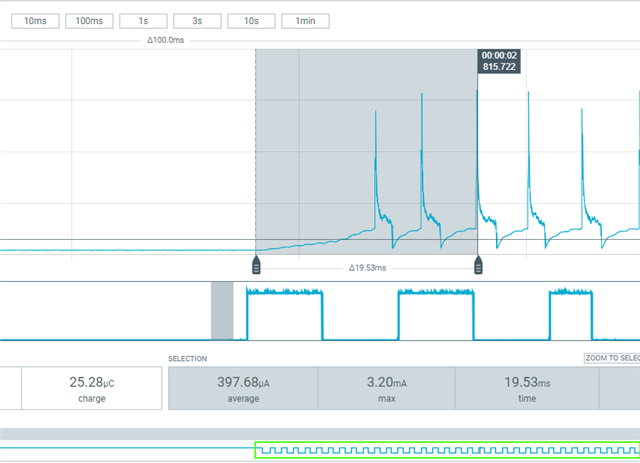
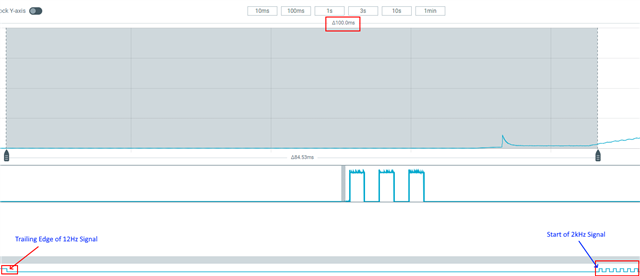
When zooming in to horizontal 100ms it can be seen that data line is not LOW, but toggles at a higher frequency (2KHz):
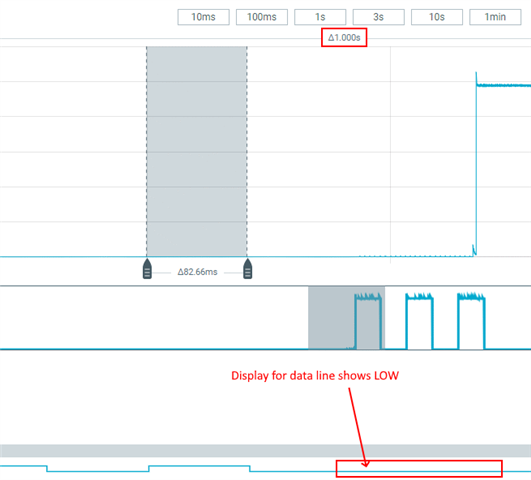
So the Power Profiler has correctly sampled the data, but the display for slow speed settings is not correct. It should look like this:
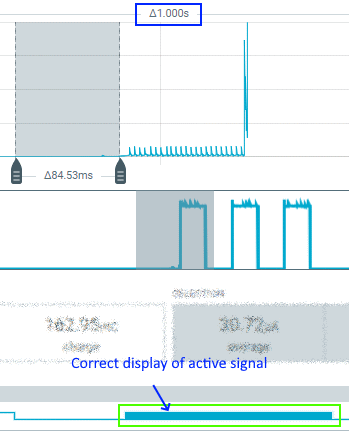
It would be really helpful if the Power Profler software would show this fast activity as a thick line between high and low to point out that there is a signal present.
Hoping that you could integrate this is in the software.
I am using Power Profiler v4.3.1 on Win10.
Best regards
Jan