I'm currently trying to integrate Memfault to my project that is using nRF9151 DK. Memfault was working fine until I turned on these configs:
# Collect LTE MetricsCONFIG_MEMFAULT_NCS_LTE_METRICS=yCONFIG_LTE_LC_EDRX_MODULE=yCONFIG_LTE_LC_PSM_MODULE=yCONFIG_MODEM_INFO=y
Then I keep getting these Usage Fault error. I'm not sure where to proceed to debug, I've increased the stack size of the system work queue but seems like it isn't that.
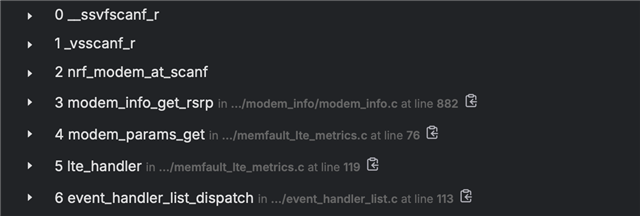
[00:01:50.408,813] <err> os: ***** USAGE FAULT *****
[00:01:50.414,489] <err> os:   Stack overflow (context area not valid)
[00:01:50.421,752] <err> os: r0/a1:  0x2000ca74  r1/a2:  0x20013fa8  r2/a3:  0x0003a024
[00:01:50.430,450] <err> os: r3/a4:  0x20014048 r12/ip:  0x000000df r14/lr:  0x00029b3b
[00:01:50.439,147] <err> os:  xpsr:  0x61000000
[00:01:50.444,396] <err> os: s[ 0]:  0x00000200  s[ 1]:  0x0002b089  s[ 2]:  0x00000000  s[ 3]:  0xe000ed00
[00:01:50.454,864] <err> os: s[ 4]:  0x2000e738  s[ 5]:  0x00000000  s[ 6]:  0x000000de  s[ 7]:  0x00027d31
[00:01:50.465,332] <err> os: s[ 8]:  0x000279d8  s[ 9]:  0x61000000  s[10]:  0x00000000  s[11]:  0x00000000
[00:01:50.475,799] <err> os: s[12]:  0x00000000  s[13]:  0x00000000  s[14]:  0x00000000  s[15]:  0x00000000
[00:01:50.486,267] <err> os: fpscr:  0x00000000
[00:01:50.491,485] <err> os: r4/v1:  0x20013fa8  r5/v2:  0x0003a024  r6/v3:  0x20014048
[00:01:50.500,213] <err> os: r7/v4:  0x20012828  r8/v5:  0x0003a024  r9/v6:  0xffffffff
[00:01:50.508,941] <err> os: r10/v7: 0x00000000  r11/v8: 0x00000000    psp:  0x20013f20
[00:01:50.517,669] <err> os: EXC_RETURN: 0xffffffac
[00:01:50.523,254] <err> os: Faulting instruction address (r15/pc): 0x0002a3b6
[00:01:40.454,498] <inf> thread_analyzer: Thread analyze:
[00:01:40.454,742] <inf> thread_analyzer:  thread_analyzer     : STACK: unused 1456 usage 592 / 2048 (28 %); CPU: 0 %
[00:01:40.454,772] <inf> thread_analyzer:                      : Total CPU cycles used: 862
[00:01:40.454,925] <inf> thread_analyzer:  date_time_work_q    : STACK: unused 728 usage 552 / 1280 (43 %); CPU: 0 %
[00:01:40.454,956] <inf> thread_analyzer:                      : Total CPU cycles used: 1143
[00:01:40.455,230] <inf> thread_analyzer:  mflt_http           : STACK: unused 1760 usage 288 / 2048 (14 %); CPU: 0 %
[00:01:40.455,261] <inf> thread_analyzer:                      : Total CPU cycles used: 1
[00:01:40.455,413] <inf> thread_analyzer:  work_q              : STACK: unused 736 usage 288 / 1024 (28 %); CPU: 0 %
[00:01:40.455,444] <inf> thread_analyzer:                      : Total CPU cycles used: 2
[00:01:40.455,871] <inf> thread_analyzer:  sysworkq            : STACK: unused 2852 usage 1244 / 4096 (30 %); CPU: 0 %
[00:01:40.455,902] <inf> thread_analyzer:                      : Total CPU cycles used: 532
[00:01:40.456,146] <inf> thread_analyzer:  logging             : STACK: unused 1412 usage 636 / 2048 (31 %); CPU: 2 %
[00:01:40.456,176] <inf> thread_analyzer:                      : Total CPU cycles used: 86038
[00:01:40.456,268] <inf> thread_analyzer:  idle                : STACK: unused 272 usage 48 / 320 (15 %); CPU: 96 %
[00:01:40.456,298] <inf> thread_analyzer:                      : Total CPU cycles used: 3168420
[00:01:40.456,726] <inf> thread_analyzer:  main                : STACK: unused 2920 usage 1176 / 4096 (28 %); CPU: 0 %
[00:01:40.456,756] <inf> thread_analyzer:                      : Total CPU cycles used: 14547
[00:01:40.457,000] <inf> thread_analyzer:  ISR0                : STACK: unused 1656 usage 392 / 2048 (19 %)
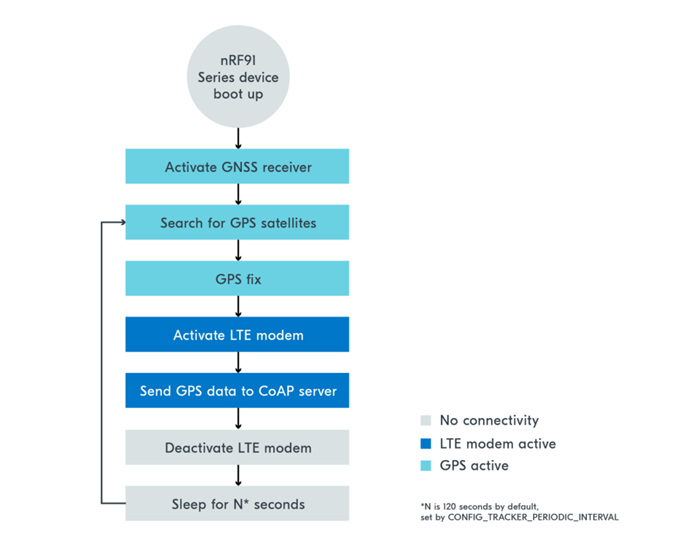
For more context, I'm following the nRF91 simple tracker solution, but instead of using CoAP, I used MQTT instead, which is in Lesson 4 of the same course. The way I switch from LTE and GNSS is the same as the exercise flowchart (attached below).
I tried using addr2line following the lesson here:
arm-zephyr-eabi-addr2line -e build/nRF9151_lte/zephyr/zephyr.elf 0x0002a3b6
But the output shows:
??:?
I'm not sure where to debug or how to approach debugging this. Any help is appreciated. Thank you.