Environment:
- Board: nRF54L15-DK (v0.9.2)
- SDK & Toolchain: nRF Connect SDK v3.1.0
- VS Code: v1.105.1
- nRF Connect for VS Code Extension: v2025.9.798
- Host PC: Windows 10
I built the "Hello World" sample from Zephyr using the build configuration with optimization level set to Optimize for debugging (-Og), and flashed it onto the nRF54L15-DK.
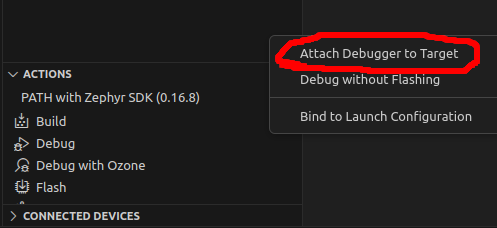
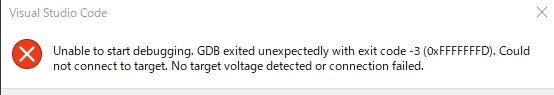
When I started debugging in VS Code, the following error message popped up:
> Unable to start debugging. GDB exited unexpectedly with exit code -3 (0xFFFFFFFD). Could not connect to target. No target voltage detected or connection failed.
This issue occurred on two different DK boards. After the failure, the USB driver on my Windows PC seemed to change unexpectedly, and the PC no longer recognized the USB ports on the DKs.
I used J-Link Configurator (J-Link config.exe) to check the driver, and found that the USB driver had switched from SEGGER to WinUSB. After restoring it back to SEGGER, USB communication was recovered.
Question:
How can I debug properly with this setup? Is there any recommended configuration or workaround to avoid this issue?