VS Code Not Finding Zephyr Include Paths

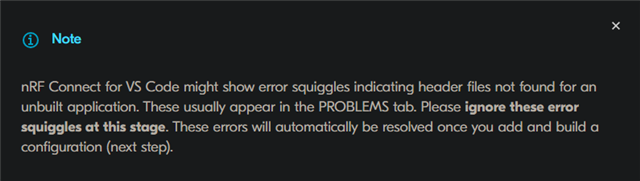
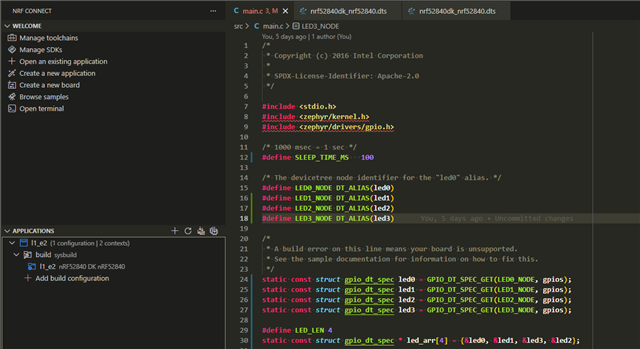
I'm following the dev academy lessons and I'm having a bit of an issue where VS Code intellisense isn't picking up on the include paths from zephyr (e.g. #include <zephyr/kernel.h>). I'm using v3.1.1 of the SDK/toolchain. The lesson says that these errors should go away after generating/building, but they aren't going away. I am able to compile just fine, so the build system is pulling in the files during compilation.

I looked through other posts on the forum and they mention a compile_commands.json, but I don't see that being generated and I'm not sure if that's relevant.

Any help is appreciated! It's very useful to be able to look through included header files, so it's a feature I'd like to be able to use, rather than needing to manually navigate to the SDK folder.

  • Hi,

    Are you able to show your observations using some simple nrf sample? 

    Can you point to the lesson which says that errors should go away?

    It's very useful to be able to look through included header files

    Can you describe what you want to do in more detail?

    Best regards,
    Dejan

  • Here's the link to the lesson that I'm using: https://academy.nordicsemi.com/courses/nrf-connect-sdk-fundamentals/lessons/lesson-1-nrf-connect-sdk-introduction/topic/exercise-2-1/

    Specifically, this blurb says they should go away:

    Here's a screenshot of my workspace:

    Can you describe what you want to do in more detail?

    It's not that I'm having a problem right now, but when working on projects, I need to be able to look through the full source code when I'm debugging issues. I need to be able to see what these kernel function calls are doing if my program is not behaving as expected. Again, I don't have a problem right now, everything compiles and works fine, but I have always needed to look through files like this during the course of my work.

  • Hi Dejan,

    Im having a similar issue. My application builds and runs fine but the "red squiggles" dont go away.
    SDK: v3.1.1
    Toolchain: v3.1.1
    nRF Connect VSCode extension: v2025.9.798

    Something else of note, in the VSCode output window (nRF Connect selected in the dropdown), I see the following error:

    [09:54:07] Stale build configuration (modbus_rtu_server_test - build): Unable to find the SDK at path: C:/ncs/v3.1.1/zephyr
    [09:54:12] Failure (code 1).
    [09:54:15] Stale build configuration (modbus_rtu_server_test - build): Unable to find the SDK at path: C:/ncs/v3.1.1/zephyr
    [09:54:15] Stale build configuration (modbus_rtu_server_test - build/modbus_rtu_server_test): Unable to find the SDK at path: C:/ncs/v3.1.1/zephyr

    I have checked that file path and there stuff there.

    I have just recently moved from SDK v2.7.0 to v3.1.1 (to get support for the nRF54L15DK).
    I did not have this issue with v2.7.0 (although that SDK does not support the nRF54)

    I too noticed the lack of `compile_commands.json` in the build output directory (where previously with v2.7.0 it was there).

    I hope this provides some more information and I look forward to hearing any other suggestions.

    Cheers

  • Hi,

    Have you tested any other sample? Is this issue also present with other samples?

    viggyd-blur said:
    I need to be able to look through the full source code when I'm debugging issues. I need to be able to see what these kernel function calls are doing if my program is not behaving as expected. Again, I don't have a problem right now, everything compiles and works fine, but I have always needed to look through files like this during the course of my work.

    Can you elaborate on this? Is there an action on your side that you would want to do but cannot do due to these error squiggles?

    Best regards,
    Dejan

  • This issue is present in other samples as well.

    Can you elaborate on this? Is there an action on your side that you would want to do but cannot do due to these error squiggles?

    I would like to view the source code of kernel function calls, but I cannot because VS Code Intellisense cannot find the headers/source files. For example, I want to see the code that is executed when the `gpio_is_ready_dt` function is called, but I cannot see the source code due to the error squiggles. 

Related