Hello,
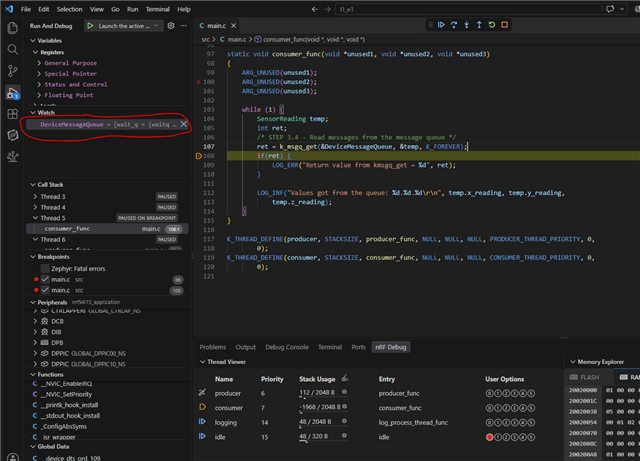
I tried following the exercise until the part where you start a debugging session. I looked at the thread viewer and the result was different than what was on the exercise. The picture below shows that the running thread is the idle thread instead of the main thread. Execution is supposed to break by default at main(). I tried manually putting a breakpoint in the main function but it didn't work either.
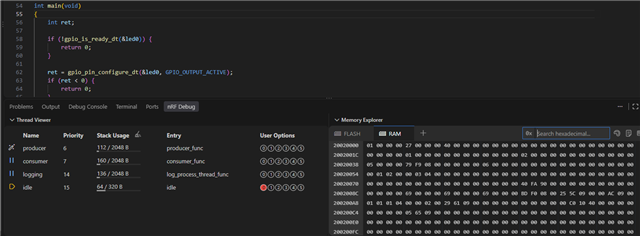
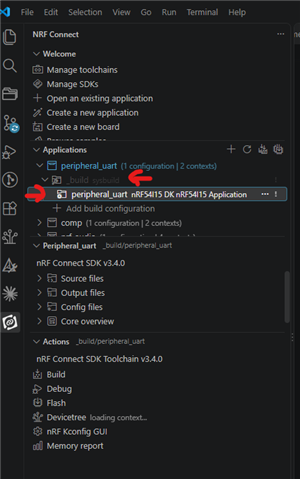
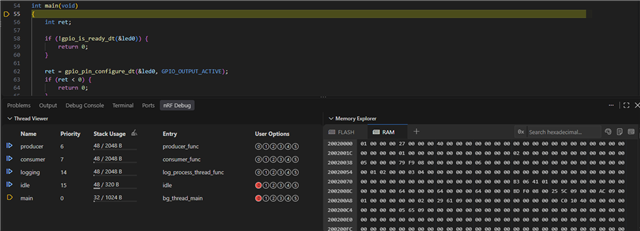
After that I tried changing the build configuration and unchecked "Include debug thread information". Somehow this fixed the problem. The result I'm getting in the thread viewer matches what's on the exercise. I can still see the thread names and stack usage even with the "Include debug thread information" unchecked.
Edit: I continued the exercise and am unable to see the details of the message queue in the watch list like in the exercise. Could this be because I unchecked "Include debug thread information"?