This post is older than 2 years and might not be relevant anymore
More Info: Consider searching for newer posts

Debugging a Hardfualt

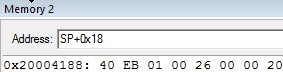
My app is generating hardfualts. Based on this post I looked at memory location SP + 0x14, which points to the address that generated the fault.

Memory at SP+0x14: 8F 31 02 00, which is address 0x0002318F. Which points to:

void on_tx_complete(const ble_evt_t * event)
{
	uint32_t err = 0;
	if(event == NULL) 
		err = 0xFF;
		APP_ERROR_CHECK(err);   
		
	tx_buffer_process();
}

The if(event == NULL) was my fatal attempt to catch the error. I had a breakpoint on err = 0xFF; that never triggered.

Using Keil's dissassembly window I see the following:

   407:         tx_buffer_process(); 
0x0002318A F001FFBD  BL.W     tx_buffer_process (0x00025108)
   408: } 
0x0002318E BD70      POP      {r4-r6,pc}
0x00023190 2E2E      DCW      0x2E2E
0x00023192 2E5C      DCW      0x2E5C
0x00023194 5C2E      DCW      0x5C2E
0x00023196 2E2E      DCW      0x2E2E
0x00023198 725C      DCW      0x725C
0x0002319A 6D65      DCW      0x6D65
0x0002319C 746F      DCW      0x746F
0x0002319E 2E65      DCW      0x2E65
0x000231A0 0063      DCW      0x0063
0x000231A2 0000      DCW      0x0000

I believe POP is loading the PC with a bad value. Is there some way I can check R4 - R7 for valid values before calling on_tx_complete()?

I can trace the call to on_tx_complete() back ble_remote_on_ble_evt(), and a BLE_EVT_TX_COMPLETE event. I don't know where to go from here. on_tx_complete() executes multiple times before the hardfualt, and the hardfualt seems to happen at random. What would have caused the hardfault? What else should I be looking at?

The call stack, when the fault occurred looked like:
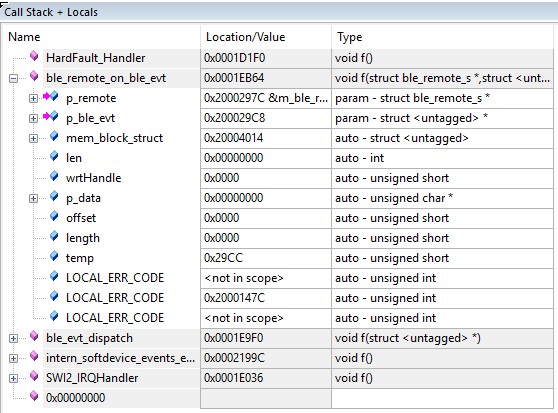
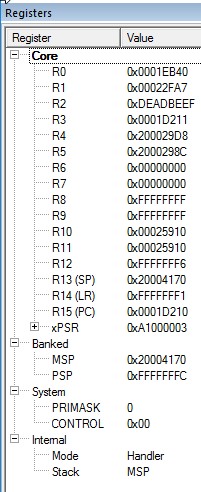
 image description

My registers have:

image description

Thanks

Parents
  • Based on your comments in: How can I distinguish the reason for hardfault? I looked at SP+0x18, which is the PC right? The word following the program counter is the PSP and has the value of: 0x20000026. The link register has: 0xFFFFFFF1 - which signifies a return from an interrupt. Using the last byte of the PSP (0x26) = 38, 38 - 16 = Interrupt 22. Which is the SWI2_IRQHandler.

    Based on what I know about ARM, is it possible that my code was executing SWI2_IRQHandler, and a higher priority interrupt occurred?

    image description image description

    Now where do I go? nrf_soc.h defines this software interrupt as: '#define SD_EVT_IRQHandler (SWI2_IRQHandler)

    The interrupt handler is in softdevice_handler.c and looks like:

    void SOFTDEVICE_EVT_IRQHandler(void)
    {
        if (m_evt_schedule_func != NULL)
        {
            uint32_t err_code = m_evt_schedule_func();
            APP_ERROR_CHECK(err_code);
        }
        else
        {
            intern_softdevice_events_execute();
        }
    }
    

    So based on ARM's documentation I think another interrupt with the same or higher priority tried to execute. What can I look for to verify this is the cause, and how to prevent it?

    My app is a central multilink device. Often when the fault occurs, I get an 0x3004 error from sd_ble_gattc_write(). I halt trying to write more data until I get a BLE_EVT_TX_COMPLETE event. I resume calling sd_ble_gattc_write(), the first call returns an error 0x0000, and then the crash occurs. Could the sd120 stack be generating a second SWI2, while I'm still servicing an earlier SWI2 interrupt. Because this second interrupt as the same priority, the ARM hard faults?

    EDIT: RK - thanks for the help! I think I've got it fixed.

    I have an application timer that was running in the IRQ. I installed the the app timer scheduler library and moved the timer to run there. So far I have not seen any more hard faults.

  • but did you actually pinpoint what it was about the timer which was causing the hardfault? Timers are not themselves prone to causing them, if you weren't calling sd_* functions from the wrong interrupt level that wasn't it, did you actually work out what the problem was?

Reply Children
No Data
Related