If you are provisioning a server the first time around (or after flash erase) you should see something similar to the following on the client console...
<t: 0>, main.c, 432, ----- BLE Mesh Light Switch Client Demo -----
<t: 0>, nrf_mesh_sdk.c, 190, Initializing softdevice
<t: 0>, nrf_mesh_sdk.c, 125, Initializing SoftDevice...
<t: 2>, nrf_mesh_sdk.c, 134, Ram base: 0x200031B8
<t: 18>, nrf_mesh_sdk.c, 200, Initializing mesh stack
<t: 296>, nrf_mesh_sdk.c, 208, Enabling mesh stack
<t: 301>, main.c, 183, Setting up access layer and models
<t: 3157745>, provisioner.c, 226, Starting provisioning for dev-uuid: 0xAA:BB:CC:DD:EE:8D
<t: 3313091>, provisioner.c, 278, Local provisioning link established...
<t: 3423959>, provisioner.c, 264, Using static authentication
<t: 3710813>, main.c, 402, Provisioning complete. Adding address 0x0100.
<t: 3815676>, provisioner.c, 111, Getting composition data
<t: 3987315>, provisioner.c, 233, Local provisioning link closed...
<t: 3989603>, provisioner.c, 321, Composition data: 0059000000000020000100000002010000020059000000
<t: 4092674>, provisioner.c, 119, Adding appkey
<t: 4182852>, provisioner.c, 128, Binding appkey to the Health model
<t: 4275555>, provisioner.c, 140, Binding appkey to the Simple On/Off model
<t: 4540729>, provisioner.c, 165, Setting publication address for the health server to 0x0001
<t: 4646250>, provisioner.c, 187, Setting publication address for the On/Off server to 0x0001
<t: 4715953>, provisioner.c, 196, Adding subscription
<t: 4720264>, main.c, 365, Configuration of device 0 successful
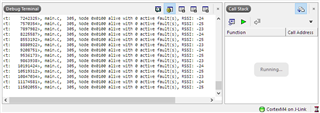
<t: 4870118>, main.c, 305, Node 0x0100 alive with 0 active fault(s), RSSI: -22
<t: 5197769>, main.c, 305, Node 0x0100 alive with 0 active fault(s), RSSI: -21
<t: 5525929>, main.c, 305, Node 0x0100 alive with 0 active fault(s), RSSI: -23
Here's an example of how the Debug Terminal should look from SES...
If you aren't running within SES then the J-Link RTT Viewer client can be used to monitor debug output from each client and respective server(s).
hi i have now try to debug it, i can see that the server do not get into the two config_params.setup_callback = configuration_setup; config_params.complete_callback = provisioning_complete;