This post is older than 2 years and might not be relevant anymore
More Info: Consider searching for newer posts

Segger Embedded Studio loops in softdevice

Hi,

My project cannot be debugged using Segger Embedded Studio. The debugger doesn't halt at the application main and instead keeps running. Hitting a pause shows the debugger at 'SEV' instruction at address 0x0001304A (which seems to be from softdevice). I am using the softdevice s132v5.1 and the application uses freertos similar to the HRS example in SDK.

Any inputs on the reason for debugger behaving so?

Thanks.

Parents
  • Hi,

    The __SEV and __WFE instructions in the softdevice are used to make the chip enter system ON idle mode (sleep), which typically is >99% of the time. In other words, there is a high probability that the PC will be at 0x0001304A when you halt the CPU. 

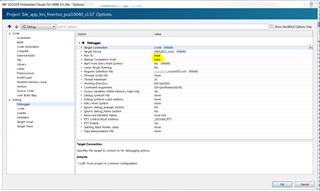
    SES projects delivered in our SDKs are configured to break at main, and I verified this with the hrs freertos example in SDK 14.2.0. Have you tried this example?

    Debugger settings to break at main:

  • Hi,

    Thanks for your response. OK. That makes sense about SEV, WFE instruction. Yes my debugger settings are fine and I am able to debug the example and my code during initial stages of the project. As more modules were added the debugger does not halt at main (instead is just in running state). The BLE DFU bootloader enters DFU mode when segger debug->go option is selected. I can't figure out why debugging invalidates the app.

Reply
  • Hi,

    Thanks for your response. OK. That makes sense about SEV, WFE instruction. Yes my debugger settings are fine and I am able to debug the example and my code during initial stages of the project. As more modules were added the debugger does not halt at main (instead is just in running state). The BLE DFU bootloader enters DFU mode when segger debug->go option is selected. I can't figure out why debugging invalidates the app.

Children
Related