Beware that this post is related to an SDK in maintenance mode
More Info: Consider nRF Connect SDK for new designs
This post is older than 2 years and might not be relevant anymore
More Info: Consider searching for newer posts

Must re-flash SoftDevice every time I debug

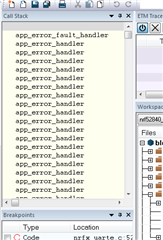
I am using the PCA10056 development board, running a custom application merging the MESH stack (2.0.1) with an IAR-based SDK v15 template, sd 140 v6.  Whenever I go to debug with my I-Jet Trace, the program only runs if I erase the chip and re-program the softDevice with nRFgo Studio.  If I go to debug or download and debug my call stack shows a few hundred app_error_handler instances and the debugger breaks in app_error_weak, so I'm assuming the stack is getting blown somewhere, or something of the like.  Why would this happen?

Parents
  • Hi,

    I assume that you have been following the guide for i"ncluding nRF5 SDK for Mesh functionality in an nRF5 SDK example", from Coexistence with nRF5 SDK BLE functionality.

    May it be something wrong with the setup with regards to downloading (the correct version of) the SoftDevice and application for debugging? Does this happen also for debugging without downloading?

    Does debugging work for a vanilla SDK example, before you add nRF5 SDK for Mesh functionality to it?

    Since you are using a PCA10056 development board, you should be able to use on-board programmer for debugging. Have you tried that instead? What is your full setup when you use the I-Jet Trace?

    Regards,
    Terje

  • I followed the Coexistence guide as best as I could.

    We have custom hardware on the way that will not be able to use the J-link.

    The issue presents itself if I just restart the debugger.  Here's what happens:

    1. erase the board and flash softdevice 6.0.0 using nRFgo Studio

    2. Download and debug my application in IAR

    3. Restart debugger (without flashing)

    4. Program breaks in app_error_handler after mesh_softdevice_init() is called.  Call stack shows recursive calls to app_error_handler.  See below photo.

    Is something written to flash during the initialization of the SD that would break the init routines?

  • Hi,

    The SoftDevice does not write anything to flash, neither on init nor at other times.

    In order to know more about when the error occurs (and when it does not) I still need to know:

    • whether using the on-board programmer works
    • whether debugging unmodified SDK examples works
    • what is your full setup (what is connected to what, how is the board powered, is it connected to anything else, what are the switches set to, etc.)

    From what you wrote in your last post, I wonder: Does debugging work at first, before resetting the debugger, but not after restarting it? (Or does it work on the first debug session, but not on debug sessions after that?) Those details may be very important.

    Regards,
    Terje

Reply
  • Hi,

    The SoftDevice does not write anything to flash, neither on init nor at other times.

    In order to know more about when the error occurs (and when it does not) I still need to know:

    • whether using the on-board programmer works
    • whether debugging unmodified SDK examples works
    • what is your full setup (what is connected to what, how is the board powered, is it connected to anything else, what are the switches set to, etc.)

    From what you wrote in your last post, I wonder: Does debugging work at first, before resetting the debugger, but not after restarting it? (Or does it work on the first debug session, but not on debug sessions after that?) Those details may be very important.

    Regards,
    Terje

Children
  • 1. The issue occurs when using the onboard debugger and with my I-jet Trace.  Symptoms are exactly the same.

    2. Running the default ble_app_blinky_c using my I-jet works just fine.

    3. I have a PCA10056 with the 20 pin debugger header soldered on.  I use that with the I-jet Trace.  Other than that nothing is connected. 

    4. Debugging works fine during the first session after erasing the board and flashing the SoftDevice.  While the program runs it may be writing to flash, but I don't know how to get an image of the board to confirm this.  Then, I debug again and it doesn't work.

  • Hi,

    Thank you for the clarification. I think we can treat this as a general issue with the particular application for now, as that seems most likely.

    You can use the command line tool nrfjprog to dump the flash contents of the SoC, with

    nrfjprog --readcode file.hex

    The full flash contents will then be stored in a hexfile named file.hex. That should reveal if flash has been written to that should not have been.

    Regards,
    Terje

  • I did my normal thing and erased the board, programmed the SoftDevice, and debugged with IAR.  I then used nrfjprog to pull off the image.  I compared it to the .hex file generated by IAR and the contents are identical.  But if I go to debug again it always fails while initializing the softDevice.  It fails if I download again and if I just debug without downloading.

    The code does appear to run if I reset the chip and I'm not debugging.

  • Did anyone resolve this issue? I'm having the same issue where I need to re-flash my board before I can download and debug my application from IAR.

    I am using SDK 17, S112 v7.0.1, a custom board with nrf52810, IAR Embedded Workbench 8.50.1, and Segger JLink.

  • For programming there are a few IAR posts, such as iar-flash-loader-error-nrf52810.

    To debug in IAR using a Softdevice the J-Link Monitor is required:

            <group>
                <name>JLink-Monitor</name>
                <excluded>
                    <configuration>nrf52832_xxaa</configuration>
                </excluded>
                <file>
                    <name>$PROJ_DIR$\..\..\..\..\..\..\JLink-Monitor\JLINK_Monitor.c</name>
                </file>
                <file>
                    <name>$PROJ_DIR$\..\..\..\..\..\..\JLink-Monitor\JLINK_MONITOR.h</name>
                </file>
                <file>
                    <name>$PROJ_DIR$\..\..\..\..\..\..\JLink-Monitor\JLINK_Monitor_ISR_IAR.s</name>
                </file>
            </group>

    This requires the companion enable in main():

       // This allows all interrupts higher than _PRIO_SD_LOW (ie 4, BLE SD stuff) to continue execution even during a break
       // note Two J-Link commands are required in command file:
       // SetMonModeDebug = 1
       // SetMonModeVTableAddr = ADDR, typically 0x2600
       //  where ADDR is the application's vector table located in FLASH, ie the start address for the
       // application, probably either 0x1B000 or 0x1C000 or 0x26000 depending on SoftDevice
       // See https://github.com/NordicPlayground/j-link-monitoring-mode-debugging
       NVIC_SetPriority(DebugMonitor_IRQn, _PRIO_SD_LOW);

Related