This post is older than 2 years and might not be relevant anymore
More Info: Consider searching for newer posts

NRF52840 repeated reboot without debugger

Hi, we are trying to work with nRF52840. We have a problem that our hardware goes into continuous reboot mode when we disconnect the JLINK debugger. The disconnect can be a hard disconnect or a soft disconnect when the debugger is "clicked" to disconnect. Seems like the crystals are not stable enough. This is just a guess.

Environment:

Debugger: IAR Workbench with JLINK debugger

Crystals: ABM11W-32.0000MHZ-8-D1X-T3, ECS-.327-12.5-34B

Load capacitors: 04025A100JAT2A

The UART which is configured at the start up seems to lose its setting. By default the idle state of an UART line is high. However, when the debugger is disconnected, I can see pulses on this UART line which seems to me that the software is trying to configure the UART but reboots eventually after that.

Please let me know what the bug is.

Parents Reply Children
  • We do not have the debug UART enabled. I will look at the Debug Processor flag.

    Even if the debug UART is enabled I do not suppose we could see anything when the processor resets.

    We have also tested this on the Evaluation board (nRF52840 Eval board) and set up the board to

    * run with external battery

    * run in "nRF Only" mode

    The behavior is similar to what we are seeing with our custom HW.

  • gauthamkarnik said:
    Even if the debug UART is enabled I do not suppose we could see anything when the processor resets.

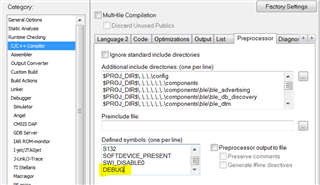
     That is the reason why we add the DEBUG Processor flag, it will prevent the reset, and should instead print the error-code.

    gauthamkarnik said:
    * run in "nRF Only" mode

     Do you see any difference if you set it to "DEFAULT" instead?

  • I agree with you on the DEBUG processor flag. I was just referring to the debug uart and not the flag.

    Regarding the DEFAULT Mode, every thing works fine. As long as we have the JTAG communications things work fine.

    Does this have anything to do with Watchdog?

  • Had a few more questions to ask

    * How can I use the internal HF oscillator to confirm if my external HF crystal is not the source of the problem?
    * Will the UART work satisfactorily well if I use the internal HF oscillator?
    * What are the symptoms of an unstable external HF crystal?
    * What happens if my RF is feeding back through the crystal path? I have an antenna which is part of the GND plane. I am feeding the RF output to a GND pattern which acts like an antenna.

  • If you are entering the APP_ERROR_CHECK() with an error code, and you have DEBUG defined and logging enabled, the app_error_fault_handler() function will print the error code. In “nRF Only mode”, the debugger IC is not powered, but if you have a logic analyzer that can parse the serial data, you can just hook the analyzer up to the UART TX pin(p0.06), and see what the error code is.

    Does this have anything to do with Watchdog?

    I don't think so.

    * How can I use the internal HF oscillator to confirm if my external HF crystal is not the source of the problem?

    First step would be to see if you get the event EVENTS_HFCLKSTARTED when you trigger the TASKS_HFCLKSTART task.

      // Start HFCLK from crystal oscillator.
      NRF_CLOCK->TASKS_HFCLKSTART = 1;
      while (NRF_CLOCK->EVENTS_HFCLKSTARTED == 0);

    * What are the symptoms of an unstable external HF crystal?

    You would see problems with peripherals that needs an accurate HF clock, e.g. the RADIO peripheral.

    * What happens if my RF is feeding back through the crystal path? I have an antenna which is part of the GND plane. I am feeding the RF output to a GND pattern which acts like an antenna.

    That is OK. It should not cause any issues.

Related