This post is older than 2 years and might not be relevant anymore
More Info: Consider searching for newer posts

Understanding Wireshark logs

Hi,

I am trying to understand Wireshark logs when sniffing packets. Please check the attachment. I have been reading about the description of advertising packets. Can you please check my logs and explain me which are the actual data packets? These logs were captured for BLE_UART example.uart_log.pcapng

Parents
  • Hello,

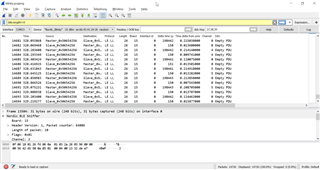
    I looked at your sniffer log, and it contains a lot of advertising devices, not only your BLE UART device. I can't see that the devices actually connect from your log, and I can't see the packets from when they are in a connection (these packages are on different channels than the advertising channels). I see that there are many different devices by the source addresses of the devices.

    If you want to capture the packets from your connection you have to select your device from the drop down menu near the top of the wireshark window. When it is selected the sniffer will filter out any other BLE packets, and it will follow the channel hopping when a device connects to your UART device.

    So to answer your question, the data packets are not included in this sniffer trace. If you filter on the Nordic UART device before you connect, you should be able to see the data packets in between the empty PDU packets that will be sent each connection interval if the devices doesn't have any actual payload to send.

    Let me know if you still can't find them after filtering on your device.

    Best regards,

    Edvin

  • I checked with ble_blinky code and have attached the wireshark log. Can you please point out the actual data packets from attached log? 

    blinky.pcapng

  • All the Empty PDU packets that you see are empty packets. Each device has to send one packet per connection interval, so they are Empty PDU packets unless it has some useful data to send.

    So, the data packets look a bit different depending on what your application is doing. Who is sending the data, and whether or not it is notifications or not.

    In the ble_app_blinky example, it is the master/central who is controlling the LED of the slave/peripheral. This means that the master is sending a write request, and the slave is responding with a write response.

    In the sniffertrace that you sent, there are first a lot of advertising packets. On packet 11908, you can see the connection request from the master. Then there are some connection establishing packets back and forth. If you look on packet 13325, you can see that the master is sending a write request with value 00. On packet 13328 the slave responds, saying that the request was granted, and now the value has changed.

    Then, on packet 13329 the master sends a read request, and packet 13332 is a response, with the value of the read request (which is 0x00, which is what the master wrote). 

    On packet 13333 the the master sends a new write request, now with value 0x01, and the slave responds on 13336, the master sends a read request on 13337 and the read response from the slave is on 13340.

    So all these packets are coming from the master toggling the LED on the slave.

    If you compare this with an example where the slave/peripheral is pushing data to the master/central through notifications, it will look a bit different. You can test with e.g. the ble_app_uart example. There the peripheral will just push the data to the master whenever it is updated. There are no read/write requests/responses on these when the peripheral is sending packets. But you will see the requests/responses when the master is writing back to the peripheral.

    Best regards,

    Edvin

Reply
  • All the Empty PDU packets that you see are empty packets. Each device has to send one packet per connection interval, so they are Empty PDU packets unless it has some useful data to send.

    So, the data packets look a bit different depending on what your application is doing. Who is sending the data, and whether or not it is notifications or not.

    In the ble_app_blinky example, it is the master/central who is controlling the LED of the slave/peripheral. This means that the master is sending a write request, and the slave is responding with a write response.

    In the sniffertrace that you sent, there are first a lot of advertising packets. On packet 11908, you can see the connection request from the master. Then there are some connection establishing packets back and forth. If you look on packet 13325, you can see that the master is sending a write request with value 00. On packet 13328 the slave responds, saying that the request was granted, and now the value has changed.

    Then, on packet 13329 the master sends a read request, and packet 13332 is a response, with the value of the read request (which is 0x00, which is what the master wrote). 

    On packet 13333 the the master sends a new write request, now with value 0x01, and the slave responds on 13336, the master sends a read request on 13337 and the read response from the slave is on 13340.

    So all these packets are coming from the master toggling the LED on the slave.

    If you compare this with an example where the slave/peripheral is pushing data to the master/central through notifications, it will look a bit different. You can test with e.g. the ble_app_uart example. There the peripheral will just push the data to the master whenever it is updated. There are no read/write requests/responses on these when the peripheral is sending packets. But you will see the requests/responses when the master is writing back to the peripheral.

    Best regards,

    Edvin

Children
  • That's a pretty nice explanation Edvin!! Thanks. Next I'll try with ble_app_uart example. One more question where are you checking the values or changes in values?

  • bscdb said:
    One more question where are you checking the values or changes in values?

     That is a pretty open question. Do you mean in the sniffer log? That would be the read requests. Do you mean in the source code? Are you talking about the peripheral or the central? 

  • How do we check values in the sniffer logs? In the previous reply, you mentioned that you noticed change in the values from 0x00 to 0x01 from my logs so if you could point out where exactly can I view that in my sniffer log.

    I did not change anything in the ble blinky example code and I'm using SDK 15.2.

  • bscdb said:
    How do we check values in the sniffer logs? In the previous reply, you mentioned that you noticed change in the values from 0x00 to 0x01 from my logs so if you could point out where exactly can I view that in my sniffer log.

     Oh. Sorry. I see.

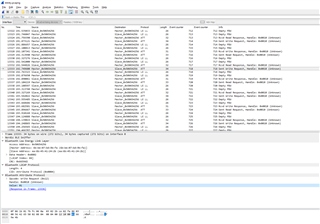
    From the log that you sent, take e.g. pack number 13333, where the master sends a write request with value 0x01. If you click the packet, it is displayed in raw data at the bottom. I don't know how to interpret this data directly, but right above the raw data there is a field that describes the packet for you. Initially, the fields are hidden, but if you expand the field called "Bluetooth Attribute Protocol" you will get some more information about the packet. There it says Value: 01. If you click this, it will also highlight in the raw data what bytes that is the value field of this packet. Check out this screenshot:

    Best regards,

    Edvin

Related