This post is older than 2 years and might not be relevant anymore
More Info: Consider searching for newer posts

Do I need to buy a Segger external debugger to get debug trace in Segger embedded studio?

Hello Nordic,

I hope you can help me. I'm using an NRF52840 DK development board. 

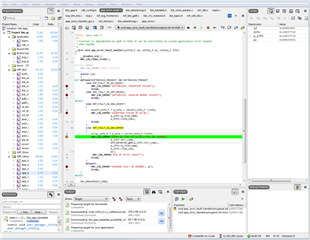
I followed the instructions on this video to enable debug trace in Segger embedded studio (https://www.youtube.com/watch?v=uP8RYgYGRvI)

When I debug I do not see any trace output. My build configuration is set to debug. 

I googled and found this page (https://devzone.nordicsemi.com/nordic/b/blog/posts/debugging-nrf52-series-devices-using-trace) which says

  • IMPORTANT: To use trace you need to have an external debugger that supports trace (trace won't work using the on-board debugger on our development kits). www.segger.com/jlink-debug-probes.html (see debug probes with built-in trace memory). IAR and ULink also offer debuggers that support trace and work with our devices.

The Segger debug probes are over $500.

I then found this page (https://devzone.nordicsemi.com/nordic/b/blog/posts/programming-and-debugging-custom-nrf5x-devices) which says 

  • When developing applications on a nRF5x Development Kit, you can program it by simply connecting it to your PC with a USB cable. This is possible because the Development Kit has an on-board debug unit supporting the JLINK debug interface.

I do not understand what I need to do to get debug trace in Segger embedded studio. 

My sdk_config.h has 

  • #define NRF_LOG_BACKEND_RTT_ENABLED 1
  • #define NRF_LOG_ENABLED 1

Thanks for your help,

-Jason

Parents
  • Yes if you want to use actual trace you need a Segger external debugger which supports trace. Trace uses a separate set of lines from the ARM microprocessor. Not many people actually need to use trace however. 

     Your second quote has nothing to do with the first, note that doesn't even mention 'trace'. You can program it using the onboard JLink just as it says you can but the onboard debugger does not support the trace outputs just as your first quote says. 

    None of that has anything at all to do with what you have enabled in your sdk_config.h, RTT, which is Real Time Terminal which allows a log output via any JLink device which then appears in the terminal pane of SES. It doesn't use the trace pins, it has nothing to do with trace. This is probably what you actually wanted in the first place, just use the logging macros with those defines enabled and the log will go to SES. 

  • Thank you.

    Do you mean logging macros like NRF_LOG_ERROR for example? Because I do not see those lines (or any others) appearing in my Debug Terminal window. 

    Running in the debugger, debug build. v15.3. Connected to my PC with USB.

    If I set a breakpoint or step through the code I can see that it is asserting with NRF_FAULT_ID_SDK_ERROR.

    Thanks again for your help.

  • Yes, 3 minutes sounds right. Latest SES I think. I moved from Windows 7 to Windows 10 last night so tonight I'll try testing again and reinstalling jlink and maybe SES. Thanks for your excellent help Grinning

  • reinstalled j-link driver but it didn't fix it. Then I reinstalled Segger embedded studio for ARM V4.16 (64-bit) Hobbyist license. It's still the same. I can see from my Subversion diff that my nRF5_SDK_15.3.0_59ac345 has no diffs in that example. 

    When I do "Build and Debug" I can see it pop up the progress bars. I know it's updating the software because I've been able to develop various examples. I press F5 to run in the debugger and nothing appears in the "Debug Terminal". When it breakpoints at 3 minutes I still see nothing in the "Debug Terminal" 

    Am I looking at the wrong window? Is it called "Debug Terminal"?

  • Ok, so I see the same problem after updating the latest Segger driver (v.6.46C). Please try to uninstall the version you installed, then install an older version, 622g for instance. The antivirus SW is preventing me from downgrading for some reason so couldn't verify this on my side.  

    The log should be displayed in the debug terminal. 

  • OK thanks, I tried to uninstall everything but I had problems with missing uninstallers (see pic below) I installed 622g but when I tested again I still didn't see anything in the debug terminal. I used Revo uninstaller to forcibly remove the broken stuff. I then reinstalled Segger Embedded Studio and made sure I didn't install the latest J-Link driver. I then installed 622g again. But it still didn't work.

    When I look in the J-Link Control panel it still shows the version as 6.44d

    I also tried manually copying the JLink_x64.dll into the C:\Program Files\SEGGER\SEGGER Embedded Studio for ARM 4.16\bin folder but it seems to stop the J-Link control panel from launching.

    I'll give up for tonight! Thanks for your help

  • You may also want to go to the Segger forums and ask there. They support JLink and SES and even if they aren't Nordic experts and can't probably comment on the code, if you're running a standard example right out of the SDK which ought to log and doesn't, they may be able to help. The entire RTT logging component is all Segger and they (well Rowley who makes SES) integrated it with the debug terminal several years ago. Especially if you're having version mismatch issues they can often help get that straightened out. 

Reply
  • You may also want to go to the Segger forums and ask there. They support JLink and SES and even if they aren't Nordic experts and can't probably comment on the code, if you're running a standard example right out of the SDK which ought to log and doesn't, they may be able to help. The entire RTT logging component is all Segger and they (well Rowley who makes SES) integrated it with the debug terminal several years ago. Especially if you're having version mismatch issues they can often help get that straightened out. 

Children
Related