This post is older than 2 years and might not be relevant anymore
More Info: Consider searching for newer posts

52840dk Segger debug exception when using softdevices.

Debugging in Segger serial example from mesh

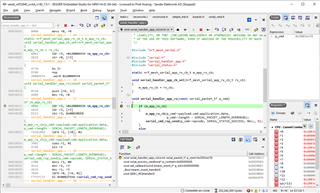
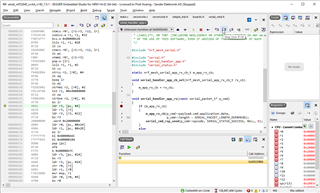
It runs and responds to commands, but when paused or hits breakpoint - single step or continue gets to address 0xa60, continue logs the message:

app_error_weak.c,   96, Softdevice assert: 154516:0

Are there some required debugger setting whne debugging with softdevices?

I was debugging sample project without the softdevice without problems - possibly there is another issue.

Parents
  • Can you please post a stack trace.
    It would be also very helpful, if you would mention your SDK & SD version.

  • Igor, sorry, it implies latest versions (released to the web)

    The 840DK ver 1.1.0

    Included two screen shots: after stopping on breakpoint, and after continue. Do not know if you could see graphics in the post, so adding those two pics as one zip.

    If I do single step in asm mode, it debugs correctly, but stepover in source is causing this exception.

    If you step in asm mode, you just issue single step to the debug logic on the core, with source stepover, most likely they insert temp break at the step target address, then run. Any run is causing probably this exception - possibly caused by pending interrupts in the exec pipeline.

    Do you know if there is a way to show low level debugger operations on the JTAG interface?

    Thx, Piotr

    Downloads.zip

Reply
  • Igor, sorry, it implies latest versions (released to the web)

    The 840DK ver 1.1.0

    Included two screen shots: after stopping on breakpoint, and after continue. Do not know if you could see graphics in the post, so adding those two pics as one zip.

    If I do single step in asm mode, it debugs correctly, but stepover in source is causing this exception.

    If you step in asm mode, you just issue single step to the debug logic on the core, with source stepover, most likely they insert temp break at the step target address, then run. Any run is causing probably this exception - possibly caused by pending interrupts in the exec pipeline.

    Do you know if there is a way to show low level debugger operations on the JTAG interface?

    Thx, Piotr

    Downloads.zip

Children
Related