This post is older than 2 years and might not be relevant anymore
More Info: Consider searching for newer posts

TRACEDATA pins during debug

I know I can set the TRACEMUX pins to 0 to enable the GPIO instead of SDO. I do this on the first line of the program. 

My problem is that when I click debug, from the time that hit debug to run, pin P1.00 is being driven high. This is unfortunately an enable pin for a high current item and it is causing the design to surge power until I can hit run or step to turn off the TRACEDATA pin. There is a pull-down on the pin, so I know it is being driven to Vdd. I can see it on the scope.

Is there a way to turn this off during program, or do I just need to move the pin? It is supposed to be a retained register, but obviously reprogramming for debug is resetting it.

Parents
  • Hi,

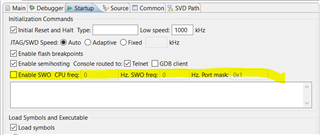
    We are missing some information here. For example which IDE are you using? And are you working on nRF SDK, NCS or bare metal?

    If you enable the ENABLE_TRACE macro when compiling, then the startup code will enable trance and configure the pins accordingly. 

    Some IDEs will set the device for tracing only if specified, but by default the pins are set as application GPIO pins after a reset.

    BR,

    Marjeris

Reply
  • Hi,

    We are missing some information here. For example which IDE are you using? And are you working on nRF SDK, NCS or bare metal?

    If you enable the ENABLE_TRACE macro when compiling, then the startup code will enable trance and configure the pins accordingly. 

    Some IDEs will set the device for tracing only if specified, but by default the pins are set as application GPIO pins after a reset.

    BR,

    Marjeris

Children
Related