
I am trying to capture sniffer logs for a custom BLE peripheral using nRF51 dongle and Wireshark. I am following this guide here to install the Sniffer tool in Wireshark.
I have programmed my nRF51 dongle using the Programmer app in nRF Connect app. I programmed it with the hex file sniffer_pca10031_129d2b3.hex because the dongle has a sticker of PCA10031 on it.
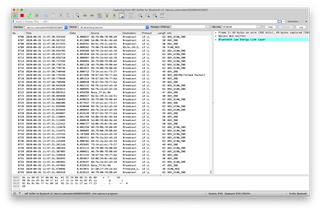
I am currently stuck at Step 4. I successfully completed step 3 and below is the result when I run the command sh nrf_sniffer_ble.sh --extcap-interfaces
usage: dirname path
extcap {version=3.0.0}{display=nRF Sniffer for Bluetooth LE}{help=https://www.nordicsemi.com/Software-and-Tools/Development-Tools/nRF-Sniffer-for-Bluetooth-LE}
interface {value=/dev/cu.usbmodem0006804533651}{display=nRF Sniffer for Bluetooth LE}
control {number=0}{type=selector}{display=Device}{tooltip=Device list}
control {number=1}{type=string}{display=Passkey / OOB key}{tooltip=6 digit temporary key or 16 byte Out-of-band (OOB) key in hexadecimal starting with '0x', big endian format. If the entered key is shorter than 16 bytes, it will be zero-padded in front'}{validation=\b^(([0-9]{6})|(0x[0-9a-fA-F]{1,32}))$\b}
control {number=2}{type=string}{display=Adv Hop}{default=37,38,39}{tooltip=Advertising channel hop sequence. Change the order in which the siffer switches advertising channels. Valid channels are 37, 38 and 39 separated by comma.}{validation=^\s*((37|38|39)\s*,\s*){0,2}(37|38|39){1}\s*$}{required=true}
control {number=3}{type=button}{role=help}{display=Help}{tooltip=Access user guide (launches browser)}
control {number=4}{type=button}{role=restore}{display=Defaults}{tooltip=Resets the user interface and clears the log file}
control {number=5}{type=button}{role=logger}{display=Log}{tooltip=Log per interface}
value {control=0}{value= }{display=All advertising devices}{default=true}
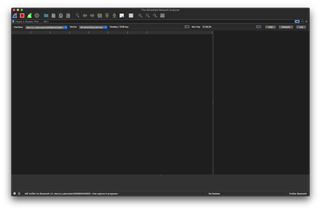
I installed the latest Wireshark version for Mac and there was no Interface Toolbars option under View. I found this post here which says that the guide was written for older version so I downgraded my Wireshark to v2.4.2 and also tried on v2.4.6 but in vain.
I tried rebooting the Wireshark software and also the laptop but the option did not appear. I also unplugged and plugged back the dongle to see any changes in the list of interfaces (after clicking Refresh) but it did not list nRF Sniffer for Bluetooth LE
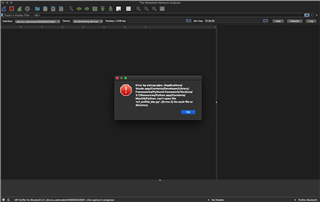
I found a similar ticket here, I made sure that my unzipped contents were swimming in the extcap directory directly and were not in a separate folder. When I ran this command
python nrf_sniffer_ble.py --extcap-interfaces
I got this error:
  File "nrf_sniffer_ble.py", line 245
    header += struct.pack('<L', int((timestamp - int(timestamp)) * 1_000_000))  # Microseconds
                                                                           ^
SyntaxError: invalid syntax
Could you please tell me how do I capture the sniffer logs? Is there an updated guide for that?

