This post is older than 2 years and might not be relevant anymore
More Info: Consider searching for newer posts

BLE packet delay with wireshark

Dear all,

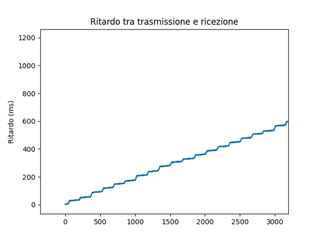
I'm using nrf52-DK with PCA10040 as sniffer. I develop 2 custom board (nRF52840) (one acting as master, one as slave) and I would like to make some considerations about packets delay. What is the most correct method to do so? I know that the field "time" is the one append by UART and that the most accurate is the field "delta time": so if a I want to calculate delay beetween trasmission and reception, which fields do I have to use?

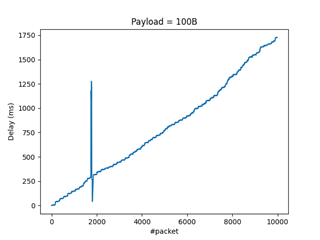
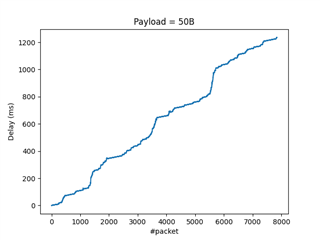
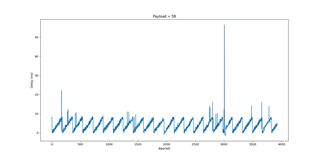
Moreover, I also tried calculating it putting the packets on 2 different serial port (after the trasmission and the reception), appending a timestamp and post-processing it, but the result (for packet bigger than 50B) is quite strange( figure: /resized-image/__size/320x240/__key/support-attachments/beef5d1b77644c448dabff31668f3a47-0514cb2d3e5046b48f0972c4924097bb/Figure_5F00_1.png). Any ideas about these?

Thanks in advance to everyone!

Parents
  • but the result (for packet bigger than 50B) is quite strange

     What exactly is strange?

    I checked out your graph. What is the X-Axis? Number of bytes in the packet? I don't understand what is strange about it. Is it the steps? How many bytes difference do you use in each sample? Is it the stair shape that you find strange?

    To measure the time between transmission and reception, one thing you can try is to just toggle a pin on the DK when you transmit (right before sd_ble_gatts_hvx()) and toggle a pin when you receive it on the other side, and use a logic analyzer to compare these two signals.

    What exactly is it that you want to measure? I don't know if you are aware about the "connection interval" in BLE and how that works? Basically, the connected devices will only communicate once every connection interval. So you will see a random delay between 0 and <connection_interval> ms.

    BR,

    Edvin

  • Hi Edvin, thanks for the fast reply. I forgot to rename the axis in english. The y-axis is the delay in ms, while the x-axis is only the number of packet (first packet, second packet, ecc ecc), with a payload of length 100B. What is strange for me is that the delay tx/rx improve during the communication, while in theory (as you said) it would be random beetween 0 and <connection_interval> (in the application 7.5 ms). 

    Of course I know about the connection interval and all the related stuff of BLE spec: I'm sending 100B over 1Mbps phy (Data Length extension and ATT_MTU size are set to the maximum, so I can send 100B (I have also debugged it with wireshark).

    The problem is that I can use an oscillosope/instrumentation only 1 times a week, and so I would like to find some strategy to compute the delay in a reliable way.

    So, do you agree with me that the figure is quite strange? With the time field of Wireshark can I compute the delay or only the connection interval?

    In theory with a payload of 100B (total PDU_SIZE = 133B), I will expect a delay around:

    delay = 133*8 = 1064 us

    Is this correct?

    Sorry for the long answer, I think that now it is all more clear.

    Thank you Edvin.

    Elia

  • Elia_pell said:
    What is strange for me is that the delay tx/rx improve during the communication

     Does it improve, or do you mean that it increases?

    If access to an oscilloscope/logic analyzer is a limitation, you can of course try to time this on one of the DKs. Start a timer that is not used by the application or the softdevice (the softdevice uses TIMER0), and sample the TIMER before TX. Then you can toggle a pin on the receiver DK. You can use this as a trigger to capture the TIMER again on the TX board using a breadboard cable. Then compare the two captures, and see how long the time is between the two. 

    If you have 3 DKs, you can run the timer application there, but you should be able to do with just two.

    The time can be measured by something like this:

    // Choose a free timer, e.g. TIMER3 (if it is not used by your application). 
    
    
    void egu_init()
    {
        NVIC_ClearPendingIRQ(SWI1_EGU1_IRQn);
        NVIC_EnableIRQ(SWI1_EGU1_IRQn);
        NRF_EGU1->INTENSET = (1 << 0) | (1 << 1);
    }
    void timer_init()
    {
        NRF_TIMER3->BITMODE                 = TIMER_BITMODE_BITMODE_32Bit << TIMER_BITMODE_BITMODE_Pos;     // 0<<0; = 0 
        NRF_TIMER3->PRESCALER               = 0;                                                            // previously 0;
        //NRF_TIMER3->SHORTS                  = TIMER_SHORTS_COMPARE0_CLEAR_Msk << TIMER_RELOAD_CC_NUM;       // 1<<0; = 1
        NRF_TIMER3->MODE                    = TIMER_MODE_MODE_Timer << TIMER_MODE_MODE_Pos;                 // 0<<0; = 0
        //NRF_TIMER3->CC[TIMER_RELOAD_CC_NUM] = TIMER_RELOAD;                                                 // 1000;
    }
    
    
    void timer_start()
    {
        NRF_TIMER3->TASKS_START = 1;
    }
    
    
    void ppi_init(uint32_t pin_in_select)
    {
        NRF_GPIOTE->CONFIG[0] = GPIOTE_CONFIG_MODE_Event << GPIOTE_CONFIG_MODE_Pos |
                                GPIOTE_CONFIG_POLARITY_Toggle << GPIOTE_CONFIG_POLARITY_Pos |
                                pin_in_select << GPIOTE_CONFIG_PSEL_Pos;
                                
        NRF_PPI->CH[0].EEP = (uint32_t)&NRF_GPIOTE->EVENTS_IN[0];
        NRF_PPI->CH[0].TEP = NRF_PPI->CH[0].TEP = (uint32_t)&NRF_TIMER3->TASKS_CAPTURE[1];
        NRF_PPI->FORK[0].TEP = (uint32_t)&NRF_EGU1->TASKS_TRIGGER[0];
    }
    
    
    void compare_timers()
    {
        uint32_t time1 = NRF_TIMER3->CC[0];
        uint32_t time2 = NRF_TIMER3->CC[1];
        uint32_t diff_ticks = time2 - time1;
        
        NRF_LOG_INFO("diff ticks: %d", diff_ticks);
        
        //Timer is running at 32MHz, so time_in_ms = diff_ticks/32000;
    }
    
    void SWI1_EGU1_IRQHandler(void) //Used to propagate event to the application
    {
        if (NRF_EGU1->EVENTS_TRIGGERED[0] != 0)
        {
            NRF_EGU1->EVENTS_TRIGGERED[0] = 0;      //Reset event triggered register.
            
            compare_timers();
        }
    }
    
    
    void my_tx_function()
    {
        NRF_TIMER3->TASKS_CAPTURE[0] = 1;
        my_already_implemented_tx_function();
    }


    Note that the reason I am using PPI to read the TIMER registes is that your CPU may be busy doing something else when you receive the pulse on the pin, and ppi allows for this capture to happen without need to wait for the CPU. The EGU is used to propagate this event to the application, so that you can use it to check the difference in time.

    Now, this only show how you can measure, in order to minimize delay in the UART. I still think I don't understand your graph. Is the delay longer and longer for each message? If so, I suspect that there is something weird with your messages.

  • Is the delay longer and longer for each message?

    Exactly like this and I don't think that this is correct, also because I expected something like this right?

    delay = 133*8 = 1064 us

    What could be the problem in your opinion? 

  • Elia_pell said:

    Exactly like this and I don't think that this is correct, also because I expected something like this right?

    delay = 133*8 = 1064 us

     No, because of the connection interval, you should see some delay between 0-<connection interval> ms + some processing time. 

    Based on the pattern that you see, does it mean that if you leave it running, it will take many seconds, and even minutes delay after enough time?

  • Based on the pattern that you see, does it mean that if you leave it running, it will take many seconds, and even minutes delay after enough time?

    Yes. I will post some figure here with different payload size. The strange thing is that now this happens also for payload size < 50B

    100B: /resized-image/__size/320x240/__key/communityserver-discussions-components-files/4/100B.png

    50B: /resized-image/__size/320x240/__key/communityserver-discussions-components-files/4/50B.png

    5B: /resized-image/__size/320x240/__key/communityserver-discussions-components-files/4/5B.png

    I really don't understand why this behavior

Reply Children
  • Do you see it as well in the application? Does it take 1 minute from you post the message until it is printed?

    How exactly do you queue your packets (the 100 bytes one)? Perhaps you are queuing up faster than the link can handle. Or you are sending faster than the UART terminal can handle. How fast/how often do you send these 100 byte messages?

    . Is there some way for me to reproduce this on a couple of DKs? I suspect there is some sort of misunderstanding here. 

    Do you check the return values from sd_ble_gatts_hvx()? (it may be called from ble_nus_data_send(), if you are using the ble_app_uart example.

  • This is the setup of our application:

    - When master and central connect, I start a timer equal to the connection interval. At the end of this timer, I send a notification to the master and put on UART the same packet.

    - At the receveir side, I put on the UART the packet receveid.

    - Connection interval is set to 7.5ms

    - NRF_SDH_BLE_GATT_MAX_MTU_SIZE 247

    - NRF_SDH_BLE_GAP_DATA_LENGTH 251

    - Github project: click here

    The return values of sd_ble_gatts_hvx() is correct (NRF_SUCCESS) and the packet is correctly sent (sniffing with Wireshark). Have a look, if you can, to the github project.

    Thank you very muvh Edvin.

  • My Italian is a bit rusty, so I find it a bit hard to follow the application logic. I tested against nRF Connect for Desktop, and I see a bunch of notifications, but I am struggling to keep up with the logic on how they are being sendt.

    I see that timer_acquisition_event_handler() is calling ble_cus_custom_value_update()

    So you are sending 100 bytes every 7.5ms. What happens if one of the packets are lost? How does that affect your measurement? Will you have a queue building up? Or will you just discard the packets that aren't queued properly?

    I can't set up the UART thing that you are using and comparing the timestamps for packets, unfortunately. But I can tell you that there is not a bug in the softdevice causing packets to be delayed. 

  • Dear Edvin,

    Thank you for your time, but I manage to solve the problem: it was an uart problem, I was sending too many bytes on the UART and my script written to read serial ports slow down the entire process. What I manage to obtain now is no more a stair case, so I think that everything is solved.

    Thanks again.

    Elia

Related