This post is older than 2 years and might not be relevant anymore
More Info: Consider searching for newer posts

timer miss interrupt when in debug mode but catch all in normal run

hello Nordic

i am working with nrf52840, SDK 16.0, s140

i use a timer for sampling of 3 adc channels, (4 times * 3 channels = 12 samples)

i put a pin to toggle in the 32Khz timer handler and i see in the oscilloscope then when i am running with the debugger i get a delay in the 8th event 

but when running without a debugger i catch all events 

what can be the reason ?

p.s. i am using SEGGER  

  • Hello,

    i put a pin to toggle in the 32Khz timer handler and i see in the oscilloscope then when i am running with the debugger i get a delay in the 8th event 

    but when running without a debugger i catch all events 

    When you say 'running with the debugger', do you mean that you are stepping through the code, or that you are letting it run continuously? Please be advised that the debugger will halt the CPU at every instruction whenever you step through the code, which may cause behavior that looks abnormal when working in pair with peripherals that work independently of the CPU.
    Could you possibly share some code of here, so I may see the event handler that suddenly is delayed?
    It would also be great to see a capture of the oscilloscope when this happens. Is the delay you observe always the same, or does it fluctuate in length?

    Looking forward to resolving this issue together,

    Best regards,
    Karl

  • do you mean that you are stepping through the code, or that you are letting it run continuously

    no breakpoints, the code runs, i observe variables in a watch that is updated twice in a second, i change it to never thinking it might change something but it didn't 

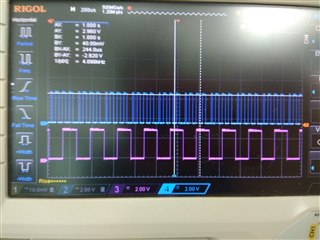
    this oscilloscope results :this one is when running the code with the debugger (the blue line) you can see that there is repetition of every 8th entry to the timer handler and it does not miss an entry but the 8th gets a bit late and the 9th is right after it

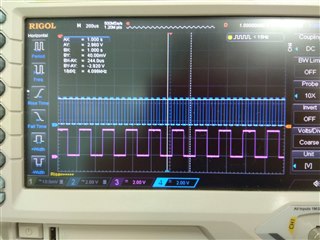
    this oscilloscope result is when running without the debugger, i start the program with the debugger and then i stop the debugger before getting to the measuring section with the timer

    regarding the code: this is how the timer is init and configure

    // samling event configurations - set timer:
    //    sd_clock_hfclk_request();
        nrf_drv_timer_config_t timer_cfg = NRF_DRV_TIMER_DEFAULT_CONFIG;
        timer_cfg.frequency = NRF_TIMER_FREQ_4MHz; // added TBD test
        timer_cfg.bit_width = NRF_TIMER_BIT_WIDTH_32;               // ?? WHAT IS THIS WIDTH ??
        err_code = nrf_drv_timer_init(&m_timer, &timer_cfg, audio_saadc_sample_timer_event_handler);  //timer_handler);
        APP_ERROR_CHECK(err_code);
    
        nrf_drv_timer_extended_compare(&m_timer, NRF_TIMER_CC_CHANNEL0, TICS_FOR_32KHZ, NRF_TIMER_SHORT_COMPARE0_CLEAR_MASK, true);
    //    nrf_drv_timer_enable(&m_timer);
    
    // samling event configurations - get handlers address: 
        uint32_t timer_compare_event_addr = nrf_drv_timer_compare_event_address_get(&m_timer, NRF_TIMER_CC_CHANNEL0);
        uint32_t saadc_sample_task_addr   = nrfx_saadc_sample_task_get();
    
    // samling event configurations - ppi timer event to start saadc sampling:
        err_code = nrf_drv_ppi_channel_alloc(&m_ppi_channel);
        APP_ERROR_CHECK(err_code);
    
        err_code = nrf_drv_ppi_channel_assign(m_ppi_channel, timer_compare_event_addr, saadc_sample_task_addr);
        APP_ERROR_CHECK(err_code);
    

    in main loop (in relevant state machine when i want measurements to begin) i enable like this:

    nrf_drv_timer_enable(&m_timer);
    err_code = nrf_drv_ppi_channel_enable(m_ppi_channel);
    APP_ERROR_CHECK(err_code);

    this is the timer handler

    static void audio_saadc_sample_timer_event_handler(nrf_timer_event_t event_type, void * p_context)
    {
       nrf_gpio_pin_toggle(DEBUG_2_PIN);  // FOR DEBUGcount_cc++; 
    }

    at the same time of this measuring with the timer there is also an i2c communication at rate of 12.5hz which is much slower and a qspi communication transmitting the collected data at rate of 16.5hz (240 adc samples)

    to make it maybe more clear the delay in timer event cause aliasing in the saadc reads analysis  

    hope this gives a better view and hope to read from you soon 

    best regards

    Ziv

  • Hello Ziv,

    Thank you for elaborating and clarifying - this is very helpful!
    This is an interesting behavior, especially so since it happens periodically on the 8th event.

    I think the issue here lies with the fact that the pin is being toggled by the CPU, which can be impeded or affected by the debugger. If the pin toggling was done through PPI there would not be any way for the debugger to delay it.
    If you setup a GPIOTE task to toggle the pin - without any interference from the CPU - and then connect it to a timer CC event through PPI, you should not see any such delays.

    ziv123 said:
    to make it maybe more clear the delay in timer event cause aliasing in the saadc reads analysis  

    Could you try to leave the timer callback for the CC event empty?
    This would ensure that there is no CPU cycles used for every SAADC sample (since the sampling is triggered by the CC event through PPI), and thus there should be no delay if you empty this event handler. How big is the SAADC buffer you are using, and could you confirm your intended SAADC sampling rate for me as well? This will determine how often the CPU needs to come into play to process the samples.

    To see if the problem indeed is that the CPU is being delayed by the debugger every so often, please have the pin toggling be triggered through PPI, or empty the timer CC event handler and see that you are getting the correct, consistent frequency from your I2C or QSPI communications.

    Looking forward to resolving this issue together!

    Best regards,
    Karl

    P.S I notice the comment in your code asking WHAT IS THIS in regards to the bit width of the timer configuration, and to answer that; it configures the number of bits used by the timer. This determines how long your counter can run before rolling over.

Related