Hi
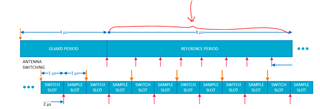
As described in this white paper: https://infocenter.nordicsemi.com/pdf/nwp_036.pdf during the reference period of CTE signals, 8 samples are taken. These samples contain both "I" and "Q" elements of signal which has different phases relatively.
I have captured the reported "I" and "Q" samples using the samples provided by SDK:
- https://developer.nordicsemi.com/nRF_Connect_SDK/doc/latest/nrf/samples/bluetooth/direction_finding_connectionless_tx/README.html
- https://developer.nordicsemi.com/nRF_Connect_SDK/doc/latest/nrf/samples/bluetooth/direction_finding_connectionless_rx/README.html
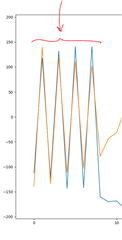
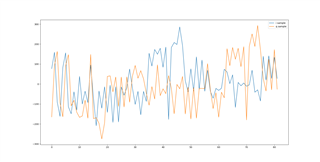
For the reference period, I can not see any phase difference between "I" and "Q" elements (while it should be different). I have visualized the data and you can see the result in the below images:
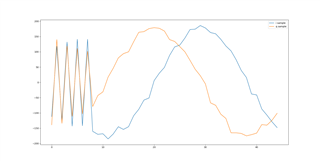
IQ samples with 2us switching slots and using PCB antenna:
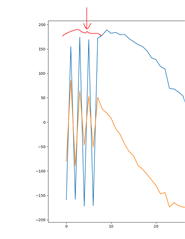
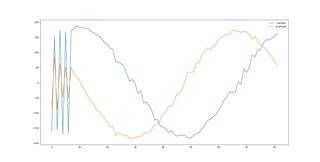
IQ samples with 1us switching slots and using PCB antenna:
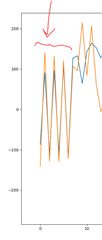
IQ samples with 1us switching slots and using array antenna:
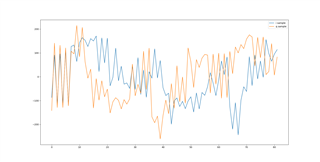
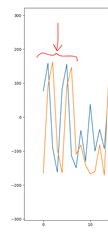
As you can see, in all conditions, the reference period has the similar behavior. I have plotted a third party product which uses the CTE packets and you can see the visualized data here,
Obviously the "I" and "Q" samples are in different phases during the reference period. What is wrong in the above nRF examples?
Regards,
Saleh