

Hi,
I am trying to implement a Data Logger using nRF52832. I am using a Temperature Sensor to get the Temp readings(logs) and a Flash Memory to store those logs.
The data logger functions first in the Advertising mode followed by the data logging mode and then Sleep mode. It wakes up in the advertising mode where the Central is connected to read the logs.
Case 1: When I am setting the following conn_params & Peripheral being connected to Central.
#define MIN_CONN_INTERVAL MSEC_TO_UNITS(7.5, UNIT_1_25_MS) /**< Minimum acceptable connection interval (0.5 seconds). */
#define MAX_CONN_INTERVAL MSEC_TO_UNITS(100, UNIT_1_25_MS) /**< Maximum acceptable connection interval (1 second). */
I can see no current peaks amidst the logs also the current consumption is between 2-3uA , as you can see in the pic below
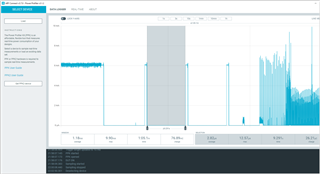
Case 2: With the following conn_params & the Peripheral is connected to Central.
#define MIN_CONN_INTERVAL MSEC_TO_UNITS(1000, UNIT_1_25_MS) /**< Minimum acceptable connection interval (0.5 seconds). */
#define MAX_CONN_INTERVAL MSEC_TO_UNITS(1000, UNIT_1_25_MS) /**< Maximum acceptable connection interval (1 second). */
So, in this case, there are current peaks as you can see in the pic below. Consequently, the current consumption has increased as well around 110uA.
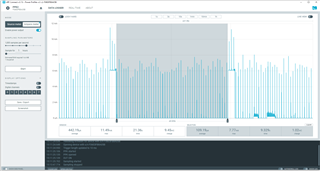
Case 3: With the same conn_params as in Case 2 but here the Peripheral is not connected to the Central.
#define MIN_CONN_INTERVAL MSEC_TO_UNITS(1000, UNIT_1_25_MS) /**< Minimum acceptable connection interval (0.5 seconds). */
#define MAX_CONN_INTERVAL MSEC_TO_UNITS(1000, UNIT_1_25_MS) /**< Maximum acceptable connection interval (1 second). */
In this case there will be no peaks similar to the Case 1, and also the current consumption is similar i.e., around 2-3 uA which can be seen from the figure below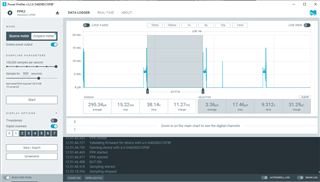
Kindly explain the reason why I am getting those peaks between the logs in Case 2 and why there are no peaks in Case 3.
Can I get similar current readings for Case 2 as was in Case 1? Is it possible? If so, kindly help.
Thanks.

