unknown function at 0x000008C8

Hello Team,

I have interfaced Oled with NRF52805 on i2C.

I have used SDK 15.1.0. and ble_app_uart example [s112].

My problem :

I have made some customized functions and I put one function inside  BLE_GAP_EVT_DISCONNECTED event [ when the device receives events from ble_evt_handler ]

- When the device receives the BLE_GAP_EVT_DISCONNECTED  event at that time I am just printing the device disconnected  message on OLED but at that time

  seggar embedded studio STOPS working  I don't know where is the exact problem!
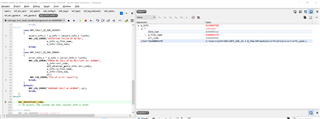
here is the code,

///////////////////////////////////////////////////////////////////////////////////////////////////////////////////////////////////////////////////////////////////////////////////////////////////////////////////////

case BLE_GAP_EVT_DISCONNECTED:

NRF_LOG_INFO("############################################### Disconnected! ###############################################");

TG_NoActivity_Timer_STOP(SYSTEM_ON_MODE); // SYSTEM ON mode Disable when device disconnected
TG_NoActivity_Timer_START(SYSTEM_OFF_MODE);// SYSTEM OFF mode Enable when device disconnected

__TG_LED_indication(TG_INDICATE_ADVERTISING_MODE);

clear_display();

if(u8LastOledPageLine>4)
{
  App_data_wth_font_size(__OLED_PAIRING_MODE, FONT_3x5, sizeof(__OLED_PAIRING_MODE),(u8LastOledPageLine-4),0); 
}
else
{
  App_data_wth_font_size(__OLED_PAIRING_MODE, FONT_3x5, sizeof(__OLED_PAIRING_MODE),(4 + u8LastOledPageLine),NULL); 
}

clear_display();

m_conn_handle = BLE_CONN_HANDLE_INVALID;
u8DeviceConnected = 0;

break;

/////////////////////////////////////////////////////////////////////////////////////////////////////////////////////////////////////////////////////////////////////////////////////////////////////////////////////////////////////////////////////////////////////////////////////////////

Note :

- The same function is working inside the BLE_GAP_EVT_CONNECTED event I have checked it several times without an issue!!

but when I placed the same function inside the BLE_GAP_EVT_DISCONNECTED event with a different message my software stops working

- I have placed DEBUG preprocessor inside the preprocessor and placed breakpoint at app_error_fault_handler inside app_error.c but it is not giving me any information like where the program is stuck.

Best and regard,

Dipak

Parents
  • Hi,

    Your topic "unknown function at 0x000008C8", and this is within the MBR which is part of the SoftDevice distribution and only provided in binary. So that will always be unknown as you don't have the source code for it.

    seggar embedded studio STOPS working

    In what was does it stop working? Please elaborate.

    - I have placed DEBUG preprocessor inside the preprocessor and placed breakpoint at app_error_fault_handler inside app_error.c but it is not giving me any information like where the program is stuck.

    Did you also disable optimizations? That is needed in order to make sense of things when you debug, as without it optimization will cause the actual binary code to be quite different from the C code you are looking at. If you have based your application on a SDK example, simply select the "Debug" build configuration as that will also disable optimization (in addition to define "DEBUG"). If not, select this your self under Code Generation -> Optimization Level. For debugging, this should be "None".  As a last point, remember that you cannot continue from a breakpoint or pausing/stopping when using a SoftDevice, as the SoftDevice will assert in this case. So if you want to step in the code, you should instead do that with a breakpoint, then move the breakpoint and reset to go further the next time. With that, you should be able to get more out of your debugging.

Reply
  • Hi,

    Your topic "unknown function at 0x000008C8", and this is within the MBR which is part of the SoftDevice distribution and only provided in binary. So that will always be unknown as you don't have the source code for it.

    seggar embedded studio STOPS working

    In what was does it stop working? Please elaborate.

    - I have placed DEBUG preprocessor inside the preprocessor and placed breakpoint at app_error_fault_handler inside app_error.c but it is not giving me any information like where the program is stuck.

    Did you also disable optimizations? That is needed in order to make sense of things when you debug, as without it optimization will cause the actual binary code to be quite different from the C code you are looking at. If you have based your application on a SDK example, simply select the "Debug" build configuration as that will also disable optimization (in addition to define "DEBUG"). If not, select this your self under Code Generation -> Optimization Level. For debugging, this should be "None".  As a last point, remember that you cannot continue from a breakpoint or pausing/stopping when using a SoftDevice, as the SoftDevice will assert in this case. So if you want to step in the code, you should instead do that with a breakpoint, then move the breakpoint and reset to go further the next time. With that, you should be able to get more out of your debugging.

Children
  • Hi Einar,

    Thanks for the reply!

    As I look in my project option there are two options are available one of them is release and the other is common

    How to set the project in DEBUG mode ? [ Please have a look at the below image ]

    Best and regards,

    Dipak

  • Also, I have disabled the optimization level to none but the result is the same as it was! 

  • Hi,

    Dipak said:
    How to set the project in DEBUG mode ?

    The example project here does not have a DEBUG build configuration (probably because of size constraints). So in this case you will have to disable optimization yourself, in addition to define DEBUG (hopefully that will fit in this small device).

    Dipak said:
    I have disabled the optimization level to none but the result is the same as it was! 

    Then it should be good and you should be able to use a debugger to see what happened by debugging in the error handler. See An introduction to error handling in nRF5 projects. In this case, with DEBUG defined and optimizations you should be able to get this. You may need to do this though:

    Either place a breakpoint in the error handler, or simply let it run to NRF_BREAKPOINT_COND. Then add p_info to watch. Then make an expression of (char*)<address you find for p_file_name when inspecting p_info>. That should look something like this:

    As you see, here there is an error on line 0x2a2 (674) in nrfx_spim.c. You should be able to use the same approach.

    (If you have trouble with this somehow, then an alternative could be to inspect every return value you feed into an APP_ERROR_CHECK() with your debugger.)

Related