Hello all
I am playing around with the nrf52dk for the last 14days, done some progress, namely the TWI is working and I can read the sensor and printing its values in the debugger inside, when the emStudio is working, without a problem, I have even started to use the RTT, indeed, JScope works all good...
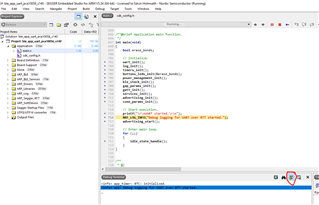
The major problem I am having is with the " Debug terminal " within the emStudio. The JLink has to be reset all most every time after the programm has been flashed... how to make this stable? I am using basic nrf_log... In addition, if you develop the RTT , do you even bother with this terminal? Or should I rather switch to the UART, putty and alike, what is the strategy usually with regard to the debugging processes ? However, I am not sure , can both be used at the same time :)
In previous setup the Arduino's pritnout and plotter was used and its design was just good enough to get the job done, indeed, the JScope looks much more sophisticated, faster, etc. however, I would like to have an option to define the thickness of the line in JScope, I still did not figure out how to use the zoom on y axis...
So far I am running the program from the emStudio , and scanning is done in the JScope, however, can this be synchronized and automatically use the preview in JScope... etc.
Please let me know what kind of a strategy are you using when debugging? Maybe I am not using the code properly, and is this why the emStudio debugging terminal has issues, needs to be reset almost every time, a bit annoying ... , or is something else , has any of you experienced similar issues?
Best.