performance issue with multi threadn in ncs with nrf52832

hello Nordic

i am working with nrf52832, with zephyr, ncs v1.7.1,

the device has a sensor that sample at 26khz each sample is 3 channels of 2 bytes data. the sensor use spi1 and has high thread priority (cooperative) the samples are then stream via a double buffer to the flash which uses spi2.

when tying to write a page (256 bytes) to the flash at a test in the beginning of the app it take 1ms to write that page but when trying to write within the app, while the other sensor is sampling, it takes 3ms and also i get a BUS FAULT. here is the log:

[00000018] <err> os: ***** BUS FAULT *****
[00000018] <err> os:   Unstacking error
[00000018] <err> os: ***** HARD FAULT *****
[00000018] [1;31m<err> os:   Fault escalation (see below)
[00000018] <err> os: ***** BUS FAULT *****
[00000018] <err> os:   Precise data bus error
[00000018] <err> os:   BFAR Address: 0xfe80fec0
[00000018] <err> os: r0/a1:  0x2000bef0  r1/a2:  0xfe80fec0  r2/a3:  0xfe80ff28
[00000018] <err> os: r3/a4:  0x2000beef r12/ip:  0xfa000000 r14/lr:  0x00016d79
[00000018] <err> os:  xpsr:  0x81000005
[00000018] <err> os: s[ 0]:  0x00000000  s[ 1]:  0x00000000  s[ 2]:  0x00000000  s[ 3]:  0x00000000
[00000018] <err> os: s[ 4]:  0x00000000  s[ 5]:  0x00000000  s[ 6]:  0x00000000  s[ 7]:  0x00000000
[00000018] <err> os: s[ 8]:  0x00000000  s[ 9]:  0x00000000  s[10]:  0x00000000  s[11]:  0x00000000
[00000018] <err> os: s[12]:  0x00000000  s[13]:  0x00000000  s[14]:  0x00000000  s[15]:  0x00000000
[00000018] <err> os: fpscr:  0x20001d78
[00000018] <err> os: Faulting instruction address (r15/pc): 0x0003ef10
[00000018] <err> os: >>> ZEPHYR FATAL ERROR 0: CPU exception on CPU 0
[00000018] <err> os: Fault during interrupt handling

[00000018] <err> os: Current thread: 0x20003210 (unknown)
[00000018] <err> fatal_error: Resetting system
*** Booting Zephyr OS build v2.6.99-ncs1-1  ***

now i do have in the app another driver that uses spi (at the same time (getting samples and writing samples to flash), but it uses a different instance of spi so i don't see why it shell create such a delay .. here is my complete .dts file:

// Copyright (c) 2022 Nordic Semiconductor ASA
// SPDX-License-Identifier: Apache-2.0

/dts-v1/;
#include <nordic/nrf52832_qfaa.dtsi>

/ {
	model = "halo_ep2";
	compatible = "halo-ep2";

	chosen {
		zephyr,sram = &sram0;
		zephyr,flash = &flash0;
		zephyr,code-partition = &slot0_partition;
		nordic,pm-ext-flash = &augu_flash_is25lp128;
	};

	sensors_on: sensors_on_node {
		compatible = "augury,gpio-power";
		power_gpios = <&gpio0 22 GPIO_ACTIVE_LOW>;
		label = "SENSORS_ON";
		status = "okay";
		#power_resource-cells = <0>;
	};

	flash_on: flash_on_node {
		compatible = "augury,gpio-power";
		power_gpios = <&gpio0 23 (GPIO_PULL_UP | GPIO_ACTIVE_LOW)>;
		label = "FLASH_ON";
		status = "okay";
		#power_resource-cells = <0>;
	};	

    leds {
        compatible = "gpio-leds";
        led0_red: led_0 {
            gpios = <&gpio0 25 GPIO_ACTIVE_HIGH>;
            label = "RED_LED_0";
        };
        led1_orange: led_1 {
            gpios = <&gpio0 26 GPIO_ACTIVE_HIGH>;
            label = "ORANGE_LED_1";
        };
        led2_green: led_2 {
            gpios = <&gpio0 27 GPIO_ACTIVE_HIGH>;
            label = "GREEN_LED_2";
        };							
    };

	aliases {
		led0-red = &led0_red;
		led1-orange = &led1_orange;
		led2-green = &led2_green;

	};
};

	&adc {
		status ="okay";
	};

	&gpiote {
		status ="okay";
	};

	&gpio0 {
		status ="okay";
	};


	&spi1 {
		compatible = "nordic,nrf-spim";
		status = "okay";
		sck-pin = <20>;
		mosi-pin = <14>;    // p0.14
		miso-pin = <16>;    // p0.16
		cs-gpios = <&gpio0 13 GPIO_ACTIVE_LOW>;
		iis3dwb@0 {
			compatible = "st,iis3dwb";
			reg = <0>;
			int1_gpios = <&gpio0 11 (GPIO_ACTIVE_HIGH | GPIO_PULL_DOWN)>;
			int2_gpios = <&gpio0 12 (GPIO_ACTIVE_HIGH | GPIO_PULL_DOWN)>;
			label = "IIS3DWB";
			power_resources = <&sensors_on>;
			spi-max-frequency = <8000000>;
		};
	};

	&spi2 {
		status = "okay";
		sck-pin = <5>; // gpio 0 pin 5
		mosi-pin = <4>; // gpio 0 pin 4
		miso-pin = <2>; // gpio 0 pin 2
		compatible = "nordic,nrf-spi";
		cs-gpios = <&gpio0 3 (GPIO_PULL_UP | GPIO_ACTIVE_LOW)>;
		augu_flash_is25lp128: augu_flash_is25lp128@0 {
			compatible = "issi,augu_flash_is25lp128";
			reg = <0>;
			label = "AUGU_FLASH_IS25LP128";
			power_resources = <&flash_on>;
			jedec_id = [9d 60 18];
			spi-max-frequency = <8000000>; //<133000000>;
			page_size = <256>;
			block_size = <65536>;
			size = <0x8000000>;
		};
	};
	&flash0 {
		partitions {
			compatible = "fixed-partitions";
			#address-cells = <1>;
			#size-cells = <1>;

			mbr_partition: partition@0 {
				label = "mbr";
				reg = <0x00000000 0x00001000>;
			};
			boot_partition: partition@1000 {
				label = "mcuboot";
				reg = <0x1000 0xc000>;
			};
			slot0_partition: partition@d000 {
				label = "image-0";
				reg = <0xd000 0x6c800>;
			};
			slot1_partition: partition@79800 {
				label = "image-1";
				reg = <0x79800 0x800>;
			};
			storage_partition: partition@7a000 {
				label = "storage";
				reg = <0x7a000 0x6000>;
			};
		};
	};

(running the app on another board with nrd52840, with nand flash that writes 2k each time, works well, so i don't know if it is a performance issue or something else.. i will also mention that the RAM take on the nrf52832 with zephyr and all is high:

[567/572] Linking C executable zephyr/zephyr.elf
Memory region         Used Size  Region Size  %age Used
           FLASH:      253604 B     419328 B     60.48%
            SRAM:       60282 B        64 KB     91.98%
        IDT_LIST:          0 GB         2 KB      0.00%
[568/572] Generating zephyr/mcuboot_primary_app.hex
[569/572] Generating zephyr/mcuboot_primary.hex
[570/572] Generating ../../zephyr/app_update.bin, ../../zephyr/app_signed.hex, ../../zephyr/app_test_update.hex, ../../zephyr/app_moved_test_update.hex
[571/572] Generating ../../zephyr/dfu_application.zip
[572/572] Generating zephyr/merged.hex

any idea why i get the BUS FAULT ? 

p.s. i don't know if it has any affect but the page data is saved in a heap section previously allocated like so

K_HEAP_DEFINE(my_heap, 3072);   // 256*3*2 = 1536 + safe buffer

int mem_heap_alloc(int size, struct k_mem_block *block)
{
    block->data = NULL;
    block->data = k_heap_alloc(&my_heap, size, K_NO_WAIT);
    if (block->data == NULL)
    {
        return -ENOMEM;
    }

    return 0;
}

void mem_heap_free(struct k_mem_block *block)
{
    k_heap_free(&my_heap, block->data);
}

and the call is for 

mem_heap_alloc(with 2 page size) 
like a double buffer for steaming the 
data collected to flash, one page gets 
fill with samples while the other is written to flash, in theaory 

the other question i will leave for now it is also regarding a try to improve the current spi_nor_write function but anyhow it will not solve the 3ms issue and if it will remain on 1ms per page write as seen in the first test then we will be ok 

we think it is a performance issue (which we don't see when the same code runs on nrf52840 with a nand flash, which also writes 2k each time and not 256 pages)

one of the possible solutions is to change the api of the sensor driver so instead of using many time fetch and get, to get one api for fetching a pointer to a buffer of the samples stored in the driver, another idea is to have the driver use easy dma to put the samples to a buffer in memory with an interrupt after reaching 256 bytes, and then write to flash from this buffer. any idea if there is some support for one of this operations in zephyr/ncs ?,

any ideas as for which is better ?

any ideas of beast way to do preferred one ?

hope to read from you soon

best regards

Ziv

Parents
  • Hi Ziv

    How are you reading the sensor over SPI? 

    Are you using the normal or the async driver?

    Running an SPI transaction every ~38us is not ideal, but it is very odd that the 256 byte write should slow down when it is running on a separate SPI bus. At the lower levels the SPI peripheral should use DMA, which means the 256 byte transaction should go through in the background (unfortunately it would have to be split in 2 transactions, since the maximum length of one transaction is 255 bytes in the nRF52832) . 

    The nRF52840 allows you to send much longer packets in a single transaction, which might be why it is working better. 

    I agree that sampling the sensor in a more automated way would be a better approach. The SPIM module in the nRF52 devices support a so called list feature, which allows you to queue a list of transactions and have them triggered in the background from a hardware event (such as a timer compare event). In this setup you could have the SPIM module run several operations in the background until you have filled the flash buffer, and run the processing and SPI interaction at a less frequent rate. 

    You will need to use the nrfx_spim driver directly in this case, since the generic Zephyr SPI driver doesn't support the list feature of the SPIM peripheral. 

    Best regards
    Torbjørn

  • hi overbekk

    How are you reading the sensor over SPI?

    yes spi1, the flash works on spi2

    Are you using the normal or the async driver?

    i have CONFIG_SPI_ASYNC=y in my .config file under the build/zephyr, so async is how i work.

    In this setup you could have the SPIM module run several operations in the background until you have filled the flash buffer

    maybe i misunderstood your intended use, but 1. i need to be writing while sampling for a second so if my buffers is filling up faster then the are dequeued then its not good enough, also since nrf52832 have 1/4 the ram the nrf52840 has, i need to find a way to reduce my buffers and not put more cause i am already around 90% ram take. 2. there is some unclear issue to work with spim in the flash cause of  CONFIG_SOC_NRF52832_ALLOW_SPIM_DESPITE_PAN_58=y,

    it fails here (on the spi_nrfx_spim.c file on the ncs (1.7.1 v): 

    		/* This SPIM driver is only used by the NRF52832 if
    		   SOC_NRF52832_ALLOW_SPIM_DESPITE_PAN_58 is enabled */
    		if (IS_ENABLED(CONFIG_SOC_NRF52832) &&
    		   (xfer.rx_length == 1 && xfer.tx_length <= 1)) {
    			LOG_WRN("Transaction aborted since it would trigger nRF52832 PAN 58");
    			error = -EIO;
    		}

    i had to change to spi

    Running an SPI transaction every ~38us is not ideal,

    the 38us spi call is called via ppi and i was thinking that what slows the flash page write is not the spi itself but available cpu and ram .. but i am not sure anymore and the coming questions are about that: 

    1. i sometimes get this error, and i wonder if it is related to the 90% ram take or is it something else ??

    [00000078] <err> spi_nrfx_spi: chunk_length - 4
    [00000078] <err> spi_nrfx_spi: chunk_length - 256
    [00000078] <err> spi_nrfx_spi: chunk_length - 0
    [00000078] <err> os: ***** MPU FAULT *****
    [00000078] <err> os:   Stacking error (context area might be not valid)
    [00000078] <err> os: r0/a1:  0xbc1c36a8  r1/a2:  0xfcb9b13f  r2/a3:  0x00000000
    [00000078] <err> os: r3/a4:  0x20007080 r12/ip:  0x00000010 r14/lr:  0x00000000
    [00000078] <err> os:  xpsr:  0x81000000
    [00000078] [1;31m<err> os: s[ 0]:  0x00000000  s[ 1]:  0x00000000  s[ 2]:  0x00000000  s[ 3]:  0x00000000
    [00000078] <err> os: s[ 4]:  0x00000000  s[ 5]:  0x00000000  s[ 6]:  0x00000000  s[ 7]:  0x00000000
    [00000078] <err> os: s[ 8]:  0x00000000  s[ 9]:  0x00000000  s[10]:  0x00000000  s[11]:  0x00000000
    [00000078] <err> os: s[12]:  0x00000000  s[13]:  0x00000000  s[14]:  0x00000000  s[15]:  0x00000000
    [00000078] <err> os: fpscr:  0x0000dd9e
    [00000078] <err> os: Faulting instruction address (r15/pc): 0x0003efe6
    [00000078] <err> os: >>> ZEPHYR FATAL ERROR 2: Stack overflow on CPU 0
    [00000078] <err> os: Current thread: 0x20003210 (unknown)
    [00000079] <err> fatal_error: Resetting system
    *** Booting Zephyr OS build v2.6.99-ncs1-1  ***
    

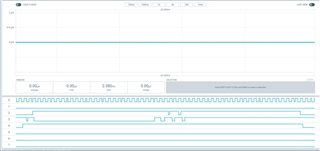
    2. i used ppk with nrf connect power manager desktop application to monitor some gpios and this is the outcome 

    (line 0 - iis3dwb sensor int1 

    line 3 - flash spi chip select 

    line 2 - gpio(0,26) which is up at the beginning of 'spi_nor_cmd_addr_write(...)' and down before the return from it.

    line 4 - gpio(0,27) - the flash_write api function ( 'spi_nor_write(...) ' ), gpio is up at entry and down before return.

    as can be seen in the following code parts:

    /* i dismissed some 'if's in the function them seems not so importent in my case
    static int spi_nor_write(const struct device *dev, off_t addr, const void *src, size_t size)
    {
    	int ret = 0;
    	uint32_t start_time_ms, end_time_ms;
    	static int counter = 0;
    
    	gpio_pin_set(gpio_dev_blue, 27, 1);
    
    	acquire_device(dev);
    
    		while (size > 0) {
    			size_t to_write = size;
    
    			/* Don't write more than a page. */
    			if (to_write >= page_size) {
    				to_write = page_size;
    			}
    
    			/* Don't write across a page boundary */
    			if (((addr + to_write - 1U) / page_size)
    			!= (addr / page_size)) {
    				to_write = page_size - (addr % page_size);
    			}
    			spi_nor_cmd_write(dev, SPI_NOR_CMD_WREN);
    			ret = spi_nor_cmd_addr_write(dev, SPI_NOR_CMD_PP, addr, src, to_write);
    			if (ret != 0) {
    				break;
    			}
    
    			size -= to_write;
    			src = (const uint8_t *)src + to_write;
    			addr += to_write;
    			counter++;
    			spi_nor_wait_until_ready(dev);
    		}
    
    	release_device(dev);
    	gpio_pin_set(gpio_dev_blue, 27, 0);
    	return ret;
    }
    
    static int spi_nor_access(const struct device *const dev,
    			  uint8_t opcode, unsigned int access,
    			  off_t addr, void *data, size_t length)
    {
    	gpio_pin_set(gpio_dev_green, 26, 1);
    	const struct spi_nor_config *const driver_cfg = dev->config;
    	struct spi_nor_data *const driver_data = dev->data;
    	bool is_addressed = (access & NOR_ACCESS_ADDRESSED) != 0U;
    	bool is_write = (access & NOR_ACCESS_WRITE) != 0U;
    	uint8_t buf[5] = { 0 };
    	
    	struct spi_buf spi_buf[2] = {
    		{
    			.buf = buf,
    			.len = 1,
    		},
    		{
    			.buf = data,
    			.len = length
    		}
    	};
    
    	buf[0] = opcode;
    	if (is_addressed) {
    		bool access_24bit = (access & NOR_ACCESS_24BIT_ADDR) != 0;
    		bool access_32bit = (access & NOR_ACCESS_32BIT_ADDR) != 0;
    		bool use_32bit = (access_32bit
    				  || (!access_24bit
    				      && driver_data->flag_access_32bit));
    		union {
    			uint32_t u32;
    			uint8_t u8[4];
    		} addr32 = {
    			.u32 = sys_cpu_to_be32(addr),
    		};
    
    		if (use_32bit) {
    			memcpy(&buf[1], &addr32.u8[0], 4);
    			spi_buf[0].len += 4;
    		} else {
    			memcpy(&buf[1], &addr32.u8[1], 3);
    			spi_buf[0].len += 3;
    		}
    	};
    
    	const struct spi_buf_set tx_set = {
    		.buffers = spi_buf,
    		.count = (length != 0) ? 2 : 1,
    	};
    
    	const struct spi_buf_set rx_set = {
    		.buffers = spi_buf,
    		.count = 2,
    	};
    
    	if (is_write) {
    		return spi_write_dt(&driver_cfg->spi, &tx_set);
    	}
    	int res = spi_transceive_dt(&driver_cfg->spi, &tx_set, &rx_set);
    	// LOG_ERR("spi_transceive_dt ret - %d\n", res);
    	gpio_pin_set(gpio_dev_green, 26, 0);
    	return res; //spi_transceive_dt(&driver_cfg->spi, &tx_set, &rx_set);
    }

    (after i moved the ' spi_nor_wait_until_ready(dev); ' from its original place to just before the ' spi_nor_cmd_write(dev, SPI_NOR_CMD_WREN); '  it did go faster but still i see there is a long delay between first read of the flash ready state to the second one, almost 1ms which is a lot in my case .. so why is it and how can i reduce it ??

    3. spi speed is set to 8mhz so passing 256 bytes should take around 250us but, looking at the nrf ppk image above, it looks like it actually takes almost 1ms for chip select to go back up..  what can cause this delay ? the flash itself can work up to 133mhz so it should not be the source for the delay

    4. going in to the  ' spi_nrfx_spi.c ' and ' spi_context.h ' for the implementation of the ' transceive(...) ' i don't understand how the ' transfer_next_chunk( ..) '  is called twice and if i understand it correct then the event handler when first spi is done calls it again, but do no check the count there only later after some if's 

    which also brings to to the efficiency question we have double calls with chunk 0 and chunk 1 for simple WREN command instead of only one dive into functions ? and the "count check" also seems wasteful sorry to say again if i understood it right then a lot of operations can be saved by checking it earlier

    and i wonder if instead of having this structure :

    struct spi_buf spi_buf[2] = {
    		{
    			.buf = buf,
    			.len = 1,
    		},
    		{
    			.buf = data,
    			.len = length
    		}
    	};

    ,which do save coping of the data to one buffer, is actually more efficient then having one spi_buf struct ? so instead of having a chunk of 4 and another chunk of 256 bytes with 2 separate spi calls, i will have one with 260 bytes ?

    5. in the following function in the spi_context.h file:

    static inline int spi_context_wait_for_completion(struct spi_context *ctx)
    {
    	int status = 0;
    	uint32_t timeout_ms;
    
    	timeout_ms = MAX(ctx->tx_len, ctx->rx_len) * 8 * 1000 /
    		     ctx->config->frequency;
    	timeout_ms += CONFIG_SPI_COMPLETION_TIMEOUT_TOLERANCE;
    
    #ifdef CONFIG_SPI_ASYNC
    	if (!ctx->asynchronous) {
    		if (k_sem_take(&ctx->sync, K_MSEC(timeout_ms))) {
    			LOG_ERR("Timeout waiting for transfer complete");
    			return -ETIMEDOUT;
    		}
    		status = ctx->sync_status;
    	}...

    i see that  CONFIG_SPI_COMPLETION_TIMEOUT_TOLERANCE=200ms by default, what should happen if i change it to '0' and is that what maybe slows the re-checking of the 'is flash ready' read command ?  also maybe i am missing something but 8000/8000000 (8Mhz = 8000000) will always come out as '0' cause 'timeout_ms' is not a double or float am i wrong ?

    6. i tried to improve the - spi_nor_cmd_addr_write(devopcodeaddrsrclength)

    with my own specific program page function: 

    p.s. also tried to implement a page program leaner function instead of the  ' spi_nor_cmd_addr_write '  which is here

    static int augu_flash_page_program(const struct device *const dev, uint32_t addr, const void* data, size_t data_length)
    {
    	const struct spi_nor_config *const driver_cfg = dev->config;
    
    	uint8_t buf[4] = { SPI_NOR_CMD_PP, 0, 0, 0 };
    
    	struct spi_buf spi_buf[2] = {
    		{
    			.buf = buf,
    			.len = 4,
    		},
    		{
    			.buf = data,
    			.len = data_length,
    		}
    	};
    
    	union {
    		uint32_t u32;
    		uint8_t u8[4];
    	} addr32 = {
    		.u32 = sys_cpu_to_be32(addr),
    	};
    	memcpy(&buf[1], &addr32.u8[1], 3);
    
    	const struct spi_buf_set tx_set = {
    		.buffers = spi_buf,
    		.count = 2,
    	};
     
    	return spi_write_dt(&driver_cfg->spi, &tx_set);
    	// return spi_transceive(&driver_cfg->spi, &tx_set, &rx_set);
    }

    but it actually took longer time which i can't understand why ?


    sorry it is a long question but i am really trying to get to the bottom of it and see how i can improve and maybe even change configurations to use the spi_nrfx_spi driver in a better way or if i have a way to make modification without changing the ncs or rewriting an spi driver myself (which i don't want to do)

    hope to read from you soon  

    best regards

    Ziv
  • Hi Ziv

    You mean to say that both the sensor and the flash is accessed without using DMA? 
    If so it will make quite a big impact on CPU usage, especially when you want to send a large transaction to the flash device. 

    I would strongly recommend integrating DMA, and rather applying the workaround code if you encounter 1 byte transactions. Can you let me know in which file you found the problematic structure with the 1 byte buffer length?

    Regarding the MPU fault, could you try to run your program with the MPU stack guard enabled, and see if you spot the stack overflow quicker?

    CONFIG_MPU_STACK_GUARD=y

    If the issue occurs more often when RAM consumption is higher it could be a stack overflow issue that isn't detected until the stack overflows into other variables.

    Best regards
    Torbjørn

  • hi Torbjørn

    You mean to say that both the sensor and the flash is accessed without using DMA? 

    no, the sensor uses ppi and spim (->uses DMA)

    Can you let me know in which file you found the problematic structure with the 1 byte buffer length?

    NCS v1.7.1, in the  zephyr/drivers/flash/spi_nor.c , in the implementation of spi_nor_access(...)

    static int spi_nor_access(const struct device *const dev,
    			  uint8_t opcode, unsigned int access,
    			  off_t addr, void *data, size_t length)
    {
    	const struct spi_nor_config *const driver_cfg = dev->config;
    	struct spi_nor_data *const driver_data = dev->data;
    	bool is_addressed = (access & NOR_ACCESS_ADDRESSED) != 0U;
    	bool is_write = (access & NOR_ACCESS_WRITE) != 0U;
    	uint8_t buf[5] = { 0 };
    	struct spi_buf spi_buf[2] = {
    		{
    			.buf = buf,
    			.len = 1,
    		},
    		{
    			.buf = data,
    			.len = length
    		}
    	};
    ....

    when calling the command WREN (write enable) it sends only one byte, also when checking for is flash ready it sends one chunk with length 1 and then the data chunk so in the 1 byte sending it fails.

    i think to avoid this i will just use the nrfx_spim directly from my flash driver make it more efficient as well 

    i tested the CONFIG_MPU_STACK_GUARD=y

    not sure what kind of extra information i was supposed to get  ???

    but this is how the MPU FAULT looks like:

    [00000022] 1m<err> os: ***** MPU FAULT *****
    [00000022] <err> os:   Stacking error (context area might be not valid)
    [00000022] [1;31m<err> os: r0/a1:  0xbc1c16a8  r1/a2:  0x7cb9b13d  r2/a3:  0x803faa2e
    [00000022] <err> os: r3/a4:  0x03ff41f3 r12/ip:  0x00000001 r14/lr:  0x00000000
    [00000022] <err> os:  xpsr:  0x81000000
    [00000022] <err> os: s[ 0]:  0x00000000  s[ 1]:  0x00000000  s[ 2]:  0x00000000  s[ 3]:  0xffffffff
    [00000022] <err> os: s[ 4]:  0x00000000  s[ 5]:  0x00000000  s[ 6]:  0x00000000  s[ 7]:  0x00000000
    [00000022] [1;31m<err> os: s[ 8]:  0x00000000  s[ 9]:  0x00000000  s[10]:  0x00000000  s[11]:  0x00000000
    [00000022] <err> os: s[12]:  0x00000000  s[13]:  0x00000000  s[14]:  0x00000000  s[15]:  0xffffffff
    [00000022] <err> os: fpscr:  0x00000000
    [00000022] <err> os: Faulting instruction address (r15/pc): 0x0003e540
    [00000022] <err> os: >>> ZEPHYR FATAL ERROR 2: Stack overflow on CPU 0
    [00000022] <err> os: Current thread: 0x20003228 (unknown)
    [00000023] <err> fatal_error: Resetting system
    *** Booting Zephyr OS build v2.6.99-ncs1-1  ***

    also there is still some delays in the app that i don't know where they come from, any tool you can recommend for better understanding that (tried CONFIG_THREAD_ANALIZE it just gives thread stack take and not in real time)  ?

    hope to read from you soon

    best regards

    Ziv
  • Hi Ziv

    I am very sorry for the slow response, I was out in holiday for the last 4 weeks. 

    Have you had any progress on your end? 

    If not I will set aside some time this week to try and reproduce the issue. 

    Best regards
    Torbjørn

  • hi Torbjørn

    i actually had a lot of progress, i freed some time from a high priority thread that enable some other things to work better, i changed the nor_spi driver to work with spim and created my own spim layer. 

    still there are some issues that i can not figure out, the MPU FAULT i don't understand how to read all the log under it and how can it help me to figure out where the problem is, it sometimes happen and sometimes not, also i can find a tool that will show in real time what tasks/threads are running and when do they context switch and how long does this switching takes

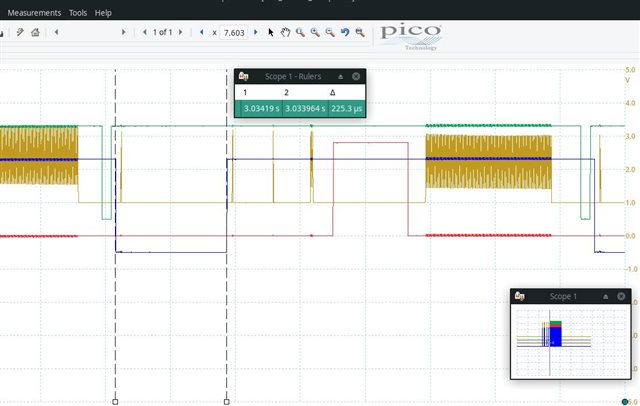
    beside the occasional MPU FAULTS,  when i want to check if flash is ready and loop on it but not all the time but with some delay, i set 50 microsecond between each call to read the flash register but for some reason, as i saw with a picoscop there is a delay of more then 200 microsecond and i don't know why .. 

    the blue line is a toggle in the following code section:

    the yello/orange line is the spi clock 

    the red line is a function running on a higher priority thread

    static int augu_nor_flash_wait_until_ready(augu_spi_data_t *spi_data, int polling_interval_usec)
    {
    	int ret = 0;
    	int count = 0;
    	uint8_t status_reg[2] = { 0, 1 }; // INITIATED WITH BUSY STATE
    	uint8_t cmd_buf[1] = { SPI_NOR_CMD_RDSR };
    	const struct device *gpio_dev_blue = device_get_binding("GPIO_0");
    	gpio_pin_toggle(gpio_dev_blue, 27);
    	ret = augu_spi_xfer(spi_data, cmd_buf, RDSR_CMD_LENGTH, status_reg, sizeof(status_reg));
    	// gpio_pin_set(gpio_dev_blue, 27, 0);
    
    	while (!ret && (status_reg[1] & SPI_NOR_WIP_BIT))
    	{
    		k_sleep(K_USEC(polling_interval_usec));
    		gpio_pin_toggle(gpio_dev_blue, 27);
    		ret = augu_spi_xfer(spi_data, cmd_buf, RDSR_CMD_LENGTH, status_reg, sizeof(status_reg));
    		// gpio_pin_set(gpio_dev_blue, 27, 0);
    
    		if(BUSY_CHECKS_COUNTS <= ++count )
    		{
    			LOG_ERR("wait for flash busy timed out!!!");
    			return -ETIMEDOUT;
    		}
    	}
    	return ret;
    }

    so, i need some help to better understand how to extract some info for the MPU FAULTS description (like the once i posted before in this thread and i add more here, maybe they are all the same), the environment what is working and what is happening underneath  

     <inf> AUGU_SPI: nrfx_ppi_channel_alloc for spi: chan = 2
    [00000010] <err> os: ***** MPU FAULT *****
    [00000010] <err> os:   Stacking error (context area might be not valid)
    [00000010] <err> os: r0/a1:  0x974b1c56  r1/a2:  0xa9037e23  r2/a3:  0xfd7b35b1
    [00000010] <err> os: r3/a4:  0x04365cc4 r12/ip:  0x00000001 r14/lr:  0x00000000
    [00000010] <err> os:  xpsr:  0x81000000
    [00000010] [1;31m<err> os: s[ 0]:  0x00000000  s[ 1]:  0x00000000  s[ 2]:  0x00000000  s[ 3]:  0x00000000
    [00000010] <err> os: s[ 4]:  0x00000000  s[ 5]:  0x00000000  s[ 6]:  0x00000000  s[ 7]:  0x00000000
    [00000010] <err> os: s[ 8]:  0x00000000  s[ 9]:  0x00000000  s[10]:  0x00000000  s[11]:  0xffffffff
    [00000010] [1;31m<err> os: s[12]:  0x00000000  s[13]:  0x00000000  s[14]:  0x00000000  s[15]:  0xffffffff
    [00000010] <err> os: fpscr:  0x00000000[0m
    [00000010] <err> os: Faulting instruction address (r15/pc): 0x0003febc
    [00000010] <err> os: >>> ZEPHYR FATAL ERROR 2: Stack overflow on CPU 0
    [00000010] <err> os: Current thread: 0x20003200 (unknown)
    [00000011] <err> fatal_error: Resetting system
    *** Booting Zephyr OS build v2.6.99-ncs1-1  ***
    
    
    [00000016] <inf> AUGU_SPI: nrfx_ppi_channel_alloc for spi: chan = 2
    [00000017] <err> os: ***** MPU FAULT *****
    [00000017] <err> os:   Stacking error (context area might be not valid)
    [00000017] <err> os: r0/a1:  0xfd7b35b1  r1/a2:  0x04365cc4  r2/a3:  0x00000001
    [00000017] <err> os: r3/a4:  0x00000000 r12/ip:  0x00000000 r14/lr:  0xe000ed00
    [00000017] <err> os:  xpsr:  0x81000000[0m
    [00000017] <err> os: s[ 0]:  0x00000000  s[ 1]:  0x00000000  s[ 2]:  0x00000000  s[ 3]:  0x00000000
    [00000017] <err> os: s[ 4]:  0x00000000  s[ 5]:  0x00000000  s[ 6]:  0x00000000  s[ 7]:  0x00000000
    [00000017] <err> os: s[ 8]:  0x00000000  s[ 9]:  0x00000000  s[10]:  0x00000000  s[11]:  0x00000000
    [00000017] <err> os: s[12]:  0x00000000  s[13]:  0xffffffff  s[14]:  0x00000000  s[15]:  0x00000000
    [00000017] [1;31m<err> os: fpscr:  0x00000000
    [00000017] <err> os: Faulting instruction address (r15/pc): 0x000321b8[0m
    [00000017] <err> os: >>> ZEPHYR FATAL ERROR 2: Stack overflow on CPU 0
    [00000017] <err> os: Current thread: 0x20003200 (unknown)
    [00000017] <err> fatal_error: Resetting system
    *** Booting Zephyr OS build v2.6.99-ncs1-1  ***
    
    
    [00000008] <inf> AUGU_SPI: nrfx_ppi_channel_alloc for spi: chan = 2
    [00000009] <err> os: ***** MPU FAULT *****
    [00000009] <err> os:   Stacking error (context area might be not valid)
    [00000009] <err> os: r0/a1:  0x974b1c56  r1/a2:  0xa9037e23  r2/a3:  0xfd7b35b1
    [00000009] <err> os: r3/a4:  0x04365cc4 r12/ip:  0x20007742 r14/lr:  0x200073e0
    [00000009] <err> os:  xpsr:  0x81000000
    [00000009] <err> os: s[ 0]:  0x00000000  s[ 1]:  0x00000000  s[ 2]:  0x00000000  s[ 3]:  0x00000000
    [00000009] <err> os: s[ 4]:  0x00000000  s[ 5]:  0x00000000  s[ 6]:  0x00000000  s[ 7]:  0x00000000
    [00000009] <err> os: s[ 8]:  0x00000000  s[ 9]:  0x00000000  s[10]:  0x00000000  s[11]:  0x00000000
    [00000009] [1;31m<err> os: s[12]:  0x00000000  s[13]:  0x00000000  s[14]:  0x00000000  s[15]:  0xffffffff
    [00000009] <err> os: fpscr:  0x00000000
    [00000009] <err> os: Faulting instruction address (r15/pc): 0x0003feb2
    [00000009] <err> os: >>> ZEPHYR FATAL ERROR 2: Stack overflow on CPU 0m
    [00000009] <err> os: Current thread: 0x20003200 (unknown)
    [00000010] <err> fatal_error: Resetting system
    *** Booting Zephyr OS build v2.6.99-ncs1-1  ***
    
    
    [00000008] <inf> AUGU_SPI: nrfx_ppi_channel_alloc for spi: chan = 2
    [00000009] <err> os: ***** MPU FAULT *****
    [00000009] <err> os:   Stacking error (context area might be not valid)
    [00000009] [1;31m<err> os: r0/a1:  0x974b1c56  r1/a2:  0xa9037e23  r2/a3:  0xfd7b35b1
    [00000009] <err> os: r3/a4:  0x04365cc4 r12/ip:  0x00000001 r14/lr:  0x00000000
    [00000009] <err> os:  xpsr:  0x81000000
    [00000009] <err> os: s[ 0]:  0x00000000  s[ 1]:  0x00000000  s[ 2]:  0x00000000  s[ 3]:  0xffffffff
    [00000009] <err> os: s[ 4]:  0x00000000  s[ 5]:  0x00000000  s[ 6]:  0x00000000  s[ 7]:  0x00000000
    [00000009] [1;31m<err> os: s[ 8]:  0x00000000  s[ 9]:  0x00000000  s[10]:  0x00000000  s[11]:  0x00000000
    [00000009] <err> os: s[12]:  0x00000000  s[13]:  0x00000000  s[14]:  0x00000000  s[15]:  0xffffffff
    [00000009] <err> os: fpscr:  0x00000000
    [00000009] <err> os: Faulting instruction address (r15/pc): 0x0003feb2
    [00000009] <err> os: >>> ZEPHYR FATAL ERROR 2: Stack overflow on CPU 0
    [00000009] [1;31m<err> os: Current thread: 0x20003200 (unknown)
    [00000010] <err> fatal_error: Resetting system
    *** Booting Zephyr OS build v2.6.99-ncs1-1  ***
    
    
    [00000017] <inf> AUGU_SPI: nrfx_ppi_channel_alloc for spi: chan = 2
    [00000018] <err> os: ***** MPU FAULT *****
    [00000018] <err> os:   Stacking error (context area might be not valid)
    [00000018] <err> os: r0/a1:  0x974b1c56  r1/a2:  0xa9037e23  r2/a3:  0xfd7b35b1
    [00000018] <err> os: r3/a4:  0x04365cc4 r12/ip:  0x00000001 r14/lr:  0x00000000
    [00000018] <err> os:  xpsr:  0x81000000
    [00000018] <err> os: s[ 0]:  0x00000000  s[ 1]:  0x00000000  s[ 2]:  0x00000000  s[ 3]:  0x00000000
    [00000018] <err> os: s[ 4]:  0x00000000  s[ 5]:  0x00000000  s[ 6]:  0x00000000  s[ 7]:  0x00000000
    [00000018] <err> os: s[ 8]:  0x00000000  s[ 9]:  0x00000000  s[10]:  0x00000000  s[11]:  0x00000000
    [00000018] <err> os: s[12]:  0x00000000  s[13]:  0x00000000  s[14]:  0x00000000  s[15]:  0xffffffff
    [00000018] <err> os: fpscr:  0x00000000
    [00000018] <err> os: Faulting instruction address (r15/pc): 0x0003feb2
    [00000018] <err> os: >>> ZEPHYR FATAL ERROR 2: Stack overflow on CPU 0
    [00000018] <err> os: Current thread: 0x20003200 (unknown)
    [00000018] <err> fatal_error: Resetting system
    *** Booting Zephyr OS build v2.6.99-ncs1-1  ***
    
    
    # at restart
    [00000000] <inf> COMM_MNG: Bluetooth advertising started! duration = 30000
    [00000000] <err> os: ***** MPU FAULT *****
    [00000000] <err> os:   Stacking error (context area might be not valid)
    [00000000] <err> os: r0/a1:  0xfd7b35b1  r1/a2:  0x04365cc4  r2/a3:  0x00000001
    [00000000] <err> os: r3/a4:  0x00000000 r12/ip:  0x20003200 r14/lr:  0x00000000
    [00000000] <err> os:  xpsr:  0x81000000
    [00000000] <err> os: s[ 0]:  0x00000000  s[ 1]:  0x00000000  s[ 2]:  0x00000000  s[ 3]:  0x00000000
    [00000000] <err> os: s[ 4]:  0x00000000  s[ 5]:  0x00000000  s[ 6]:  0x00000000  s[ 7]:  0x00000000
    [00000000] <err> os: s[ 8]:  0x00000000  s[ 9]:  0x00000000  s[10]:  0x00000000  s[11]:  0x00000000
    [00000000] <err> os: s[12]:  0x00000000  s[13]:  0x00000000  s[14]:  0x00000000  s[15]:  0xffffffff
    [00000000] <err> os: fpscr:  0x00000000
    [00000000] <err> os: Faulting instruction address (r15/pc): 0x0003feb2
    [00000000] <err> os: >>> ZEPHYR FATAL ERROR 2: Stack overflow on CPU 0
    [00000000] <err> os: Current thread: 0x20003200 (unknown)
    [00000002] <err> fatal_error: Resetting system
    *** Booting Zephyr OS build v2.6.99-ncs1-1  ***
    

    hope to read from you soon

    best regards 

    Ziv

  • Hi Ziv,


    It seems that you have stack issues, most likely related to the stack size of the current thread running.

    To backtrack a fault, you can use arm-none-eabi-addr2line with the faulting address as an input:

    arm-none-eabi-addr2line -e build-folder/zephyr/zephyr.elf 0x0003febc


    In this case, you probably want to check which thread faulted, which you can check by opening your .map file in build-folder/zephyr/zephyr.map, and find which thread is running on "0x20003200", and then increase the stack for this specific thread.

    If that is the main thread, you can increase it by adjusting "CONFIG_MAIN_STACK_SIZE" in your prj.conf.


    Kind regards,

    Håkon

Reply
  • Hi Ziv,


    It seems that you have stack issues, most likely related to the stack size of the current thread running.

    To backtrack a fault, you can use arm-none-eabi-addr2line with the faulting address as an input:

    arm-none-eabi-addr2line -e build-folder/zephyr/zephyr.elf 0x0003febc


    In this case, you probably want to check which thread faulted, which you can check by opening your .map file in build-folder/zephyr/zephyr.map, and find which thread is running on "0x20003200", and then increase the stack for this specific thread.

    If that is the main thread, you can increase it by adjusting "CONFIG_MAIN_STACK_SIZE" in your prj.conf.


    Kind regards,

    Håkon

Children
  • hi Håkon

    sorry for the delay..

    in build-folder/zephyr/zephyr.map, and find which thread is running on "0x20003200", and then increase the stack for this specific thread.

    i found this 

    .bss.logging_thread
                    0x0000000020003200       0xd8 zephyr/libzephyr.a(log_core.c.obj)
                    0x0000000020003200                logging_thread

    not sure which LOG, why should log thread fail and how should i deal with it, given i already at 92% of ram usage (so i can not just increase stacks how ever i want i assume

    this are some of the sizes in my .config file: 

    CONFIG_LOG_PROCESS_THREAD_STACK_SIZE=768
    CONFIG_IDLE_STACK_SIZE=320
    CONFIG_ISR_STACK_SIZE=2048
    CONFIG_THREAD_STACK_INFO=y
     
    To backtrack a fault, you can use arm-none-eabi-addr2line with the faulting address as an input:

    i am not sure how/where to use the line you added using the nrf Connect extension hope you can guide me a little bit on that


    hope to read you soon

    best regards

    Ziv

  • Hi Ziv,


    ziv123 said:

    i am not sure how/where to use the line you added using the nrf Connect extension hope you can guide me a little bit on that

    Unfortunately, the vscode plugin cannot do a reverse lookup for you.

    You'll need to use the command line prompt, or the internal terminal in vscode for this, here's an example on how to quickly open a build catalog from vs code:


    Then you run:

    c:\path\to\gnuarmemb\bin\arm-none-eabi-addr2line -e zephyr\zephyr.elf 0xFAULTING_ADDRESSES


    However, in this case it seems that your logging thread is running out of memory, so you'll need to adjust the stack size for it, which is done through this config that you posted:

    ziv123 said:
    CONFIG_LOG_PROCESS_THREAD_STACK_SIZE

    Try adjusting it to 1024 (or higher) to see if the fault disappears.


    Kind regards,

    Håkon

  • hi Håkon

    Try adjusting it to 1024 (or higher) to see if the fault disappears.

    though increasing it to 1024, seems to help at first look, i still wonder cause we have another board with the same code base that runs on nrf52840 (has larger RAM and FLASH), it has the same value in the CONFIG_LOG_PROCESS_THREAD_STACK_SIZE and we don't get the MPU FAULTS with it so it makes me wonder if that is the solution 

    this is my path for the compiler - /opt/gcc-arm-none-eabi-10.3-2021.10/ and under it there is no file or fir named "arm-none-eabi-addr2line" so again, not sure what is the command

    hope to read you soon

    best regards

    Ziv

  • Hi,


    ziv123 said:
    though increasing it to 1024, seems to help at first look, i still wonder cause we have another board with the same code base that runs on nrf52840 (has larger RAM and FLASH), it has the same value in the CONFIG_LOG_PROCESS_THREAD_STACK_SIZE and we don't get the MPU FAULTS with it so it makes me wonder if that is the solution 

    Logging is dynamic, ie. based on what is happening in real-time. A compiled image for 52832 and nrf52840 will differ, and timing on the bluetooth link (if running) also have some randomness thrown into the mix here. 

    ziv123 said:
    this is my path for the compiler - /opt/gcc-arm-none-eabi-10.3-2021.10/ and under it there is no file or fir named "arm-none-eabi-addr2line" so again, not sure what is the command

    I have the exact same version installed, and it's there at my end:

    /opt/gcc-arm-none-eabi-10.3-2021.10/bin/arm-none-eabi-addr2line


    If you have gcc (x86/x86-64) installed on your system, you can technically just call "addr2line" instead.

    Kind regards,

    Håkon

  • hi Håkon

    /opt/gcc-arm-none-eabi-10.3-2021.10/bin/arm-none-eabi-addr2line

    any idea whats wrong ?

Related