Simulation in VS like SES

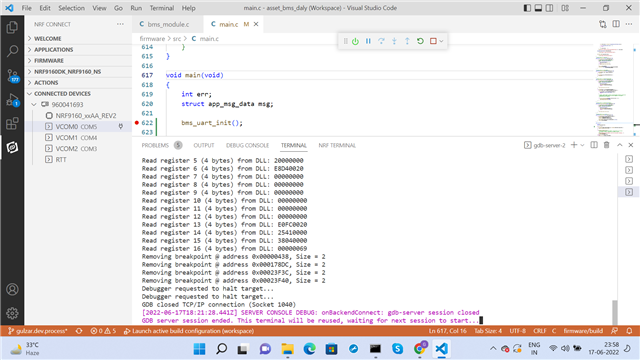
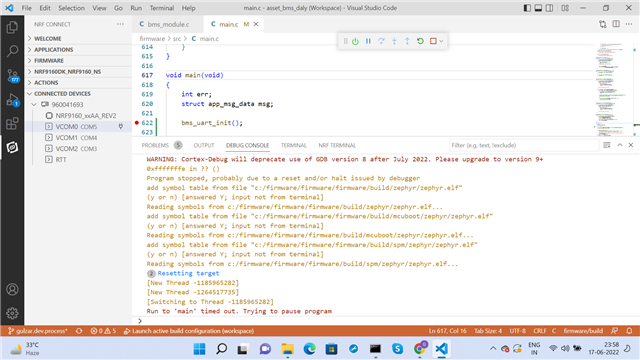
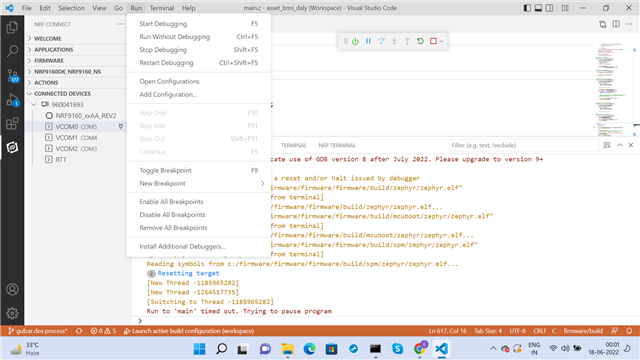
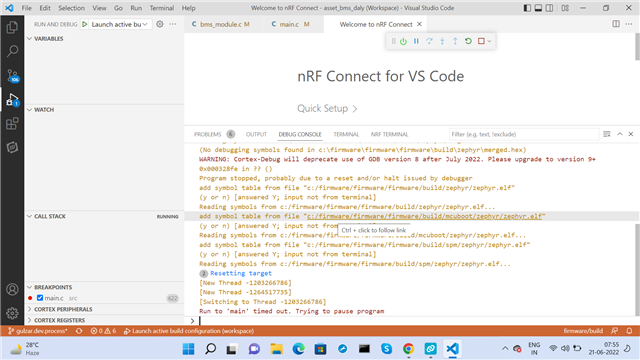
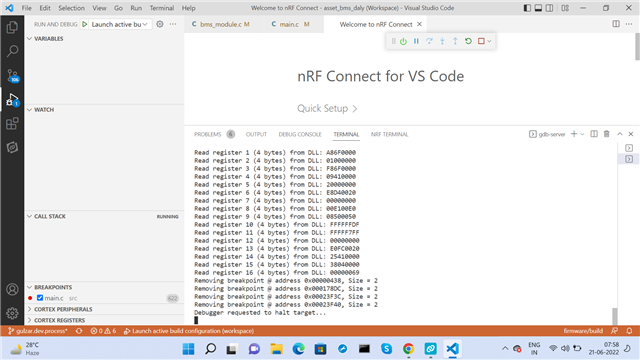
Earlier I created a project in SES for nRF5340. The simulation and debugging was quiet simple and easy to find the fatal errors, run time errors etc. Same features are not so well present in VS.  I opened asset_tracker_v2 project in VS. When clicked RUN->start debug, the terminal and Debug outputs are shown in images. I added a custom function to main() and set a breakpoint there.  The debugger is halted. I observed that step over and step into options also are not fade as shown in third image. If there are any run time issues / errors, where are these displayed ?


Parents
  • Hi,

    Which version of the SDK are you using and how are you initiating the debugging session, i.e are you trying to run the debugger with the internal debugger in VSCode or are you running it with the debugger in the nRF Connect Extension for VSCode?

    I would also recommend you take a look at this similar issue and this one to see if there are anything of help in those two tickets that might.

    Kind regards,
    Andreas 

  • I checked that extension is installed (See image). How to use ?? I tried by launching the icon on left side panel . Then the Debug CONSOL and terminal messages are as shown in 2nd and 3rd images.

    1. What does "Run to Main "Time out" mean"  in debug CONSOL and why this ?

    2. Is there any other debugger plugin available like PlatformIO ? The PlatformIO has support for nRF51, 52 and 53 series only, whereas I need to work on nRF91.

    3. Where id GDB installed by default in VS ? 

    Is t  

  • Hi,

    mexco said:
    I checked that extension is installed (See image). How to use ??

    We recommend that you follow either the automatic installation guide using the toolchain manager or the manual installation guide when setting up your nRF Connect Software Development Kit (nRF Connect SDK). I will also recommend that you take the NCS fundamentals course to get familiar with how the SDK is set up and how to create and modify applications in the SDK.

    Furthermore you will need to install nrf Command line tools (please se the step in the tutorial before installing) which useful tools required for debugging and using our tools.

    mexco said:
    1. What does "Run to Main "Time out" mean"  in debug CONSOL and why this ?

    The debug session times out due to an error in either your application or with your SDK setup. Did you have "Enable debug options" selected when generating the build configuration? Please try to generate the build configuration with this option unchecked after ensuring that your development environment is properly configured

    mexco said:
    2. Is there any other debugger plugin available like PlatformIO ? The PlatformIO has support for nRF51, 52 and 53 series only, whereas I need to work on nRF91.

    See nRF Command Line Tools, J-Link and the installation process mentioned above

    mexco said:
    3. Where id GDB installed by default in VS ? 

    Have you checked VSCodes appdata folder? Extensions installed within VSCode are typically rooted in the appdata or installation folder of VSCode.

    Kind regards,
    Andreas

Reply
  • Hi,

    mexco said:
    I checked that extension is installed (See image). How to use ??

    We recommend that you follow either the automatic installation guide using the toolchain manager or the manual installation guide when setting up your nRF Connect Software Development Kit (nRF Connect SDK). I will also recommend that you take the NCS fundamentals course to get familiar with how the SDK is set up and how to create and modify applications in the SDK.

    Furthermore you will need to install nrf Command line tools (please se the step in the tutorial before installing) which useful tools required for debugging and using our tools.

    mexco said:
    1. What does "Run to Main "Time out" mean"  in debug CONSOL and why this ?

    The debug session times out due to an error in either your application or with your SDK setup. Did you have "Enable debug options" selected when generating the build configuration? Please try to generate the build configuration with this option unchecked after ensuring that your development environment is properly configured

    mexco said:
    2. Is there any other debugger plugin available like PlatformIO ? The PlatformIO has support for nRF51, 52 and 53 series only, whereas I need to work on nRF91.

    See nRF Command Line Tools, J-Link and the installation process mentioned above

    mexco said:
    3. Where id GDB installed by default in VS ? 

    Have you checked VSCodes appdata folder? Extensions installed within VSCode are typically rooted in the appdata or installation folder of VSCode.

    Kind regards,
    Andreas

Children
Related