MPSL thread being blocked due to application threads

Hi,

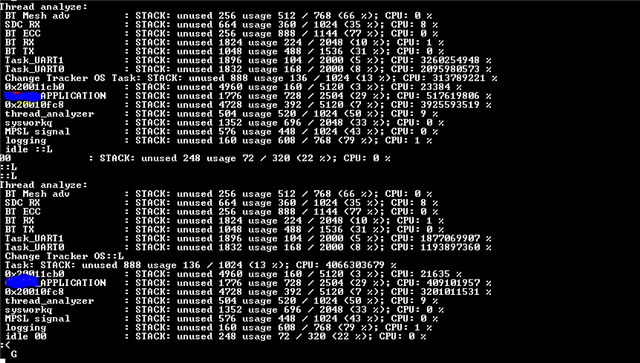
With reference to the below image:

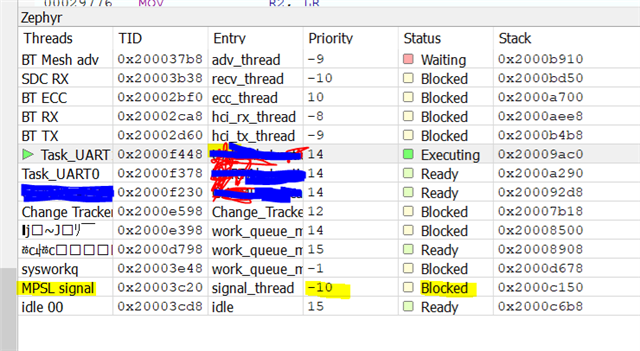
As you can see I have 2 UART threads running on priorities 14, at baud 115200, which are I believe blocking the MPSL signal thread, due to which my BLE Mesh models are responding to OPCODES with a delay of 9 mins & at time getting stuck without progressing. Further I also observed BT APIs reaching maximum retries.

I need your help with 2 things:

1. How can I get this to work whilst retaining my application & UART threads..?

2. How can I probe the CPU utilization further to find out what is happening or what is the issue leading to MPSL thread being blocked..?

Thanks,

Ubaid

Parents
  • Hi,

    Looking at the documentation here, I don't really see how your application threads are causing issues:

    The scheduler distinguishes between two classes of threads, based on each thread’s priority.

    • A cooperative thread has a negative priority value. Once it becomes the current thread, a cooperative thread remains the current thread until it performs an action that makes it unready.

    • A preemptible thread has a non-negative priority value. Once it becomes the current thread, a preemptible thread may be supplanted at any time if a cooperative thread, or a preemptible thread of higher or equal priority, becomes ready.

    2. How can I probe the CPU utilization further to find out what is happening or what is the issue leading to MPSL thread being blocked..?

    You can try to use the CPU load measurement module: https://developer.nordicsemi.com/nRF_Connect_SDK/doc/2.0.2/nrf/libraries/debug/cpu_load.html

    It's expected that these MPSL threads are 'blocked' most of the time, they are waiting for semaphore in the mpsl irq handler. https://github.com/nrfconnect/sdk-nrf/blob/v1.9.2/subsys/mpsl/init/mpsl_init.c#L53

    Q: Does your application work as expected when you don't have these UART threads? If yes, could you post how these threads looks like ?

  • Hello ,


    You can try to use the CPU load measurement

    1. Can you please suggest any tool or add on that gives me thread wise details on CPU occupancy..?
    Any live monitoring would help.


    I don't really see how your application threads are causing issues

    This is what I felt as well, But as soon as I comment out the two UART threads & one application threads, my mesh models behave completely fine and response to OPCODES is instantaneous.

    Does your application work as expected when you don't have these UART threads?

    Yes, as soon as I comment out the two UART threads & one application threads, my mesh models behave completely fine.
    2. I also observed that by reducing UART baud rate from 115200 to 9600, there was some improvement. Hence I suspect any interrupts are occupying the CPU or any dependent resource like semaphore is unavailable to MPSL thread...?

    could you post how these threads looks like ?

    Will get back on this.

    Thanks,

  • Hi,

    I did that and it is running and printing stats only once,
    Please look at my prj.conf if everything is in order:

    #Analyse threads
    CONFIG_THREAD_ANALYZER=y
    CONFIG_THREAD_ANALYZER_AUTO=y
    CONFIG_THREAD_ANALYZER_AUTO_INTERVAL=5
    CONFIG_THREAD_NAME=y
    CONFIG_THREAD_MONITOR=y
    CONFIG_THREAD_RUNTIME_STATS=y
    CONFIG_THREAD_RUNTIME_STATS_USE_TIMING_FUNCTIONS=y
    CONFIG_THREAD_ANALYZER_USE_LOG=y
    CONFIG_THREAD_ANALYZER_USE_PRINTK=y

    Or printing junk with this config:

    I just need stack and CPU consumption thread wise

  • Hi,

    I was able to run the same, Thread analyzer is working perfectly fine and printing stats when I disable my application thread, please find the stats as in below and suggest if anything wrong here:

    Now if I enable my application thread, thread analyzer is unable to run (I think since it is lower priority task, app thread being higher priority thread is not letting thread analyzer thread to execute), below are the stats:

    Do let me know your thoughts on these stats as well.

    I need  to know how I can optimize my thread based on the above stats:
    1. In first, system reset thread is occupying 93% CPU
    2. In second after enabling app thread, thread analyzer is not at all getting the CPU and main is occupying 84% CPU.

    Thanks,

  • Hi,

    could you post how these threads looks like ?
    Will get back on this.

    Could you post the code that shows these threads? (I can make this case private if you want to.)

  • Hi ,

    I was able to work put some issues and now all threads are being scheduled.

    However, some thread are getting junk prints for CPU utilization as in below:

    How can I solve this..?

    Thanks

Reply Children
Related